A Practical Guide to Managing Data Quality at Scale
Managing data quality is not a project; it’s a continuous, operational function. The objective is to ensure your data is accurate, complete, consistent, and reliable from ingestion to consumption. This discipline directly fuels everything from AI model performance to strategic decision-making and regulatory compliance.
Why Managing Data Quality Is a Core Business Function
In 2025, poor data quality has moved from a technical problem to a direct threat to revenue and operational efficiency. It erodes customer trust, derails AI initiatives, and produces flawed business strategies that cost millions. For data leaders, the stakes have never been higher.
The financial damage is well-documented. Gartner’s research points to an average annual cost of $12.9 million per organization due to unreliable data. MIT Sloan estimates that poor-quality data can eliminate 15-25% of revenue for global companies.
The impact is particularly acute in sales and marketing operations. According to Validity’s comprehensive 2025 report, 37% of users have lost revenue directly because of poor CRM data. Furthermore, 76% admit that less than half of their CRM records are accurate. This degradation stems from data silos, inconsistent formats, and the increasing volume of data from disparate cloud and IoT sources.
The Real-World Impact of Neglecting Data Quality
When data quality is not managed, it triggers a domino effect of operational failures. A marketing team launching a personalization campaign with incomplete customer profiles wastes ad spend and alienates prospects. A supply chain model fed outdated inventory data misjudges demand, leading to stockouts during peak seasons.
These are not hypotheticals; they are the daily reality for businesses that treat data quality as an afterthought. Without a disciplined approach, your powerful analytics platforms—whether Snowflake, Databricks, or another—are merely processing garbage at high speed.
A proactive data quality program is not about achieving perfection. It is about systematically reducing business risk and making every decision, model, and customer interaction more reliable.
Shifting From Projects to a Continuous Program
The only effective approach is to stop treating data quality as a series of isolated cleanup projects. It must be a continuous, automated program embedded directly into daily operations. This means building quality checks into data pipelines and establishing clear ownership from the point of data creation.
A modern data quality strategy is built on several key pillars:
- Clear Definitions and KPIs: Establish a common, quantitative language for what “good” data means.
- Proactive Detection: Use automated monitoring to identify issues before they corrupt downstream systems.
- Defined Remediation Playbooks: Create clear, repeatable procedures for correcting bad data at its source.
- Strong Governance: Implement data contracts and assign stewardship to enforce standards and accountability.
This guide provides a blueprint for building and scaling that program. We will detail the practical steps to move from reactive firefighting to proactive, automated data quality management.
From Ambiguity to Action with Data Quality KPIs
You cannot manage what you do not measure. Vague complaints about “bad data” are unproductive. The first step in managing data quality is to define what “good” looks like for your business by establishing clear Key Performance Indicators (KPIs).
This is a critical business activity, not an IT checklist. In 2025, data quality has become the top data integrity challenge for 64% of organizations, a significant increase from 50% in 2023. According to Precisely’s 2025 planning insights, the primary drivers are inadequate tooling (49%) and inconsistent data definitions (45%), exacerbated by exploding data volumes. Encouragingly, approximately 60% of organizations now prioritize data quality as a key investment.
Conducting Your First Data Quality Assessment
Before setting targets, you must establish a baseline. An initial data quality assessment provides a snapshot of your current state, identifying the most urgent problems. This process begins with data profiling.
Data profiling is a diagnostic health check for your data. It involves systematically scanning datasets to understand their structure, content, and relationships. Automated tools can analyze columns to identify value distributions, frequency counts, null rates, and other statistical summaries. This process uncovers hidden issues: unexpected nulls, incorrectly formatted values, or outliers that skew analytics. You would not start a fitness regimen without knowing your baseline metrics; the same principle applies here.
Defining Meaningful KPIs Beyond Vanity Metrics
With a baseline established, you can define KPIs that are directly relevant to business operations. Avoid generic metrics that look good on a presentation but do not drive action. Each KPI should connect a specific data quality dimension to a real-world business process.
Here is a framework for effective KPIs:
- Accuracy: How well does the data reflect reality?
- Real-world KPI: Product Price Accuracy > 99.8%. This prevents e-commerce pricing mismatches with the inventory system, avoiding lost revenue and customer dissatisfaction.
- Completeness: Are all essential fields populated?
- Real-world KPI: New Customer Record Completeness > 95% for all required fields. This improves marketing segmentation and streamlines customer onboarding.
- Consistency: Is the same data represented identically across systems?
- Real-world KPI: Customer Address Format Consistency Score of 98% between CRM and ERP systems. This check prevents shipping errors.
- Timeliness: Is the data available when needed?
- Real-world KPI: Sales Transaction Data Latency < 5 minutes from point-of-sale to the analytics warehouse. This enables real-time sales tracking.
- Uniqueness: What is the rate of duplication in the system?
- Real-world KPI: Customer Record Duplication Rate < 0.5%. This prevents sending multiple marketing communications to the same individual.
- Validity: Does the data conform to defined rules?
- Real-world KPI: Product SKU Validity at 99.9% against the master product catalog. This is fundamental for maintaining inventory integrity.
Good KPIs are specific, measurable, and tied to a business function. “Improving data” is a wish; “Achieving 95% customer record completeness to reduce marketing waste by 10%” is a goal.
Visualizing Progress with Scorecards and Dashboards
Defining KPIs is necessary but not sufficient. To drive engagement, especially from executive stakeholders, the information must be visible, accessible, and easily understood. Data quality scorecards and dashboards are essential for this purpose.
These tools translate technical metrics into a clear, visual narrative about the health of your data.
An effective dashboard should:
- Summarize Overall Health: Provide a top-level score (e.g., a percentage or grade) for a quick overview.
- Drill Down by Dimension: Allow users to explore performance on specific dimensions like accuracy, completeness, or timeliness.
- Track Trends Over Time: Show whether quality is improving, degrading, or remaining static, thereby demonstrating program efficacy.
- Assign Ownership: Clearly indicate which team or Data Steward is accountable for the quality of each dataset.
This visualization transforms data quality from an abstract concept into a manageable operational metric. A downward trend on a chart compels discussion and action. This is a cornerstone of effective data governance strategies, which provide the framework to enforce these standards across the organization.
Architecting Your Modern Data Quality Tech Stack
Selecting the right data quality tools requires a systematic approach. The goal is not to purchase a single piece of software but to assemble a cohesive tech stack that integrates with your existing environment, automates repetitive tasks, and builds trust in your data.
An effective setup is not a monolithic platform but a layered, defense-in-depth strategy, using specialized tools that cover the entire data lifecycle.
The Four Pillars of a Modern DQ Stack
Mapping tools to core functions simplifies the selection process. A modern data quality system is built on four distinct but interconnected pillars.
-
Data Profiling Tools: These are your initial reconnaissance tools. They scan raw data to provide an overview of its structure and content—value distributions, null counts, data types. This analysis is foundational, informing your initial assessment and highlighting key risk areas before you write a single quality rule.
-
Monitoring and Observability Platforms: If profiling is the initial health check, observability is the continuous monitoring system. These platforms track data pipelines in real-time, detecting operational issues like schema drift, unexpected latency, or sudden changes in row counts. They are your primary defense against “unknown unknowns”—unexpected issues that break dashboards and compromise models.
-
Validation and Testing Frameworks: This is where you enforce the business logic your data must follow. Tools like dbt Tests allow you to codify expectations and embed them directly into your data transformation pipelines. This “shift-left” approach catches predictable errors before they reach downstream consumers.
-
Data Catalogs with Lineage: The data catalog acts as the central nervous system of your data stack. It provides critical context: data ownership, column definitions, and, most importantly, data lineage. When a quality issue arises, lineage provides a map for tracing the problem to its source and identifying all affected downstream assets.
Key Evaluation Criteria for Selecting Tools
When evaluating tools, focus on integration, workflow support, and total cost of ownership.
Your evaluation checklist should prioritize these areas:
- Seamless Integration: Does the tool connect natively to your core platforms, such as Snowflake or Databricks? Does it require custom scripts that are brittle and difficult to maintain?
- Support for Automation: Can you define quality checks as code? Does it integrate with your CI/CD process for automated testing and deployment? Manual processes do not scale.
- Advanced Anomaly Detection: Does the tool use machine learning to detect patterns you haven’t explicitly defined, or is it limited to hard-coded rules?
- Collaboration and Workflow: When an issue is detected, what is the resolution process? A good tool facilitates resolution through integrations with platforms like Slack or Jira to assign ownership and track progress.
- Scalability and Performance: Can the tool handle your largest datasets without causing pipeline delays?
- Total Cost of Ownership (TCO): The license fee is only part of the cost. Factor in implementation, training, and ongoing engineering maintenance.
The best tool is not the one with the most features; it is the one your team will actually use. Prioritize ease of use and deep integration into existing workflows to ensure adoption.
This vendor-agnostic checklist can help you cut through marketing claims and compare solutions based on what matters to your organization.
Data Quality Tool Evaluation Checklist
| Evaluation Category | Key Criteria to Assess | Red Flags to Watch For |
|---|---|---|
| Connectivity & Integration | Native connectors for your data sources, BI tools, and orchestrators. API availability and documentation quality. | Reliance on third-party integration tools; outdated or poorly documented APIs. |
| Core Functionality | Breadth of checks (profiling, validation, reconciliation). Support for custom, user-defined rules. | Limited check types; inability to define complex business logic as code. |
| Automation & Operations | CI/CD integration. Scheduling capabilities. Performance impact on data pipelines. | Manual rule deployment; significant performance overhead; lack of alerting integrations. |
| Usability & Collaboration | Intuitive UI for non-technical users. Workflow for issue triage and remediation. Role-based access control. | Clunky interface; requires deep technical expertise for basic use; no collaboration features. |
| Scalability & Architecture | Ability to handle petabyte-scale data. Separation of compute and storage. Deployment options (SaaS, self-hosted). | Poor performance on large datasets; monolithic architecture that doesn’t scale. |
| Intelligence & Discovery | ML-based anomaly detection. Automated rule recommendations. Data lineage and impact analysis. | Rule-based only; no “unknown unknown” detection; lineage is manual or non-existent. |
| Support & TCO | Quality of technical support and documentation. Pricing model (e.g., usage-based, per-user). Implementation and training costs. | Opaque or complex pricing; poor customer reviews on support; significant hidden costs. |
This checklist provides a solid foundation for a procurement process, ensuring you select a tool that fits your specific needs.
The Impact of a Well-Architected Stack
A well-architected toolset delivers significant returns. Teams with integrated data quality solutions can reduce manual data cleaning efforts by 60-80% and see a 40-70% reduction in data-related incidents.
These are not just efficiency metrics; they translate to faster, more accurate decisions and increased confidence in your organization’s data assets. With 64% of firms still citing data quality as a top challenge, a well-designed tech stack provides a significant competitive advantage. You can see more about how the best data quality tools deliver these results in various industries.
Your data quality tech stack is a core component of your overall data strategy. Architecting it thoughtfully around these pillars and evaluation criteria builds a resilient foundation for proactive data management. To understand how these components fit into the larger ecosystem, see our guide on designing a modern data stack.
Putting Your Data Quality Program Into Practice
A strong tech stack and well-defined KPIs are just the foundation. A data quality program proves its value in daily operations. Effective execution requires moving from theory to the practical mechanics of detecting, triaging, and remediating bad data.
Your operational program must be built on clear, repeatable playbooks. Relying on individual heroics is not a scalable strategy. You need a structured, predictable response for when things go wrong, from the moment an alert is triggered to its final resolution.
From Detection to Remediation
The first step is to transition from manual spot-checks to automated detection. Your monitoring and observability tools should be configured to raise an alert the instant a data quality rule is breached—whether it’s a sudden spike in nulls or an unexpected schema change from an upstream source.
Once an alert is triggered, a clear triage process is essential:
- Initial Triage: The on-call data engineer or analyst validates the alert. Is it a genuine data issue or a false positive from the monitoring tool?
- Impact Assessment: If the issue is real, the next question is: “What is the business impact?” Using a data catalog with lineage, the team can immediately see which downstream dashboards, ML models, or operational systems are affected.
- Ownership and SLAs: Based on the data asset’s defined ownership, the issue is routed to the correct Data Steward. A Service Level Agreement (SLA) dictates the urgency. Critical issues affecting financial reports might require a one-hour response, while a minor issue in a secondary dataset gets a 24-hour window.
This structured workflow prevents alerts from being ignored and ensures clear accountability.
The purpose of a remediation playbook is not just to fix the immediate problem. It is to drive a root-cause analysis that answers one critical question: “How do we prevent this specific failure from happening again?”
The Power of Proactive Prevention
Constant firefighting is inefficient and indicates an immature program. The best data quality programs focus on preventing issues before they occur. This “shift-left” approach pushes quality checks as far upstream as possible, closer to the data source.
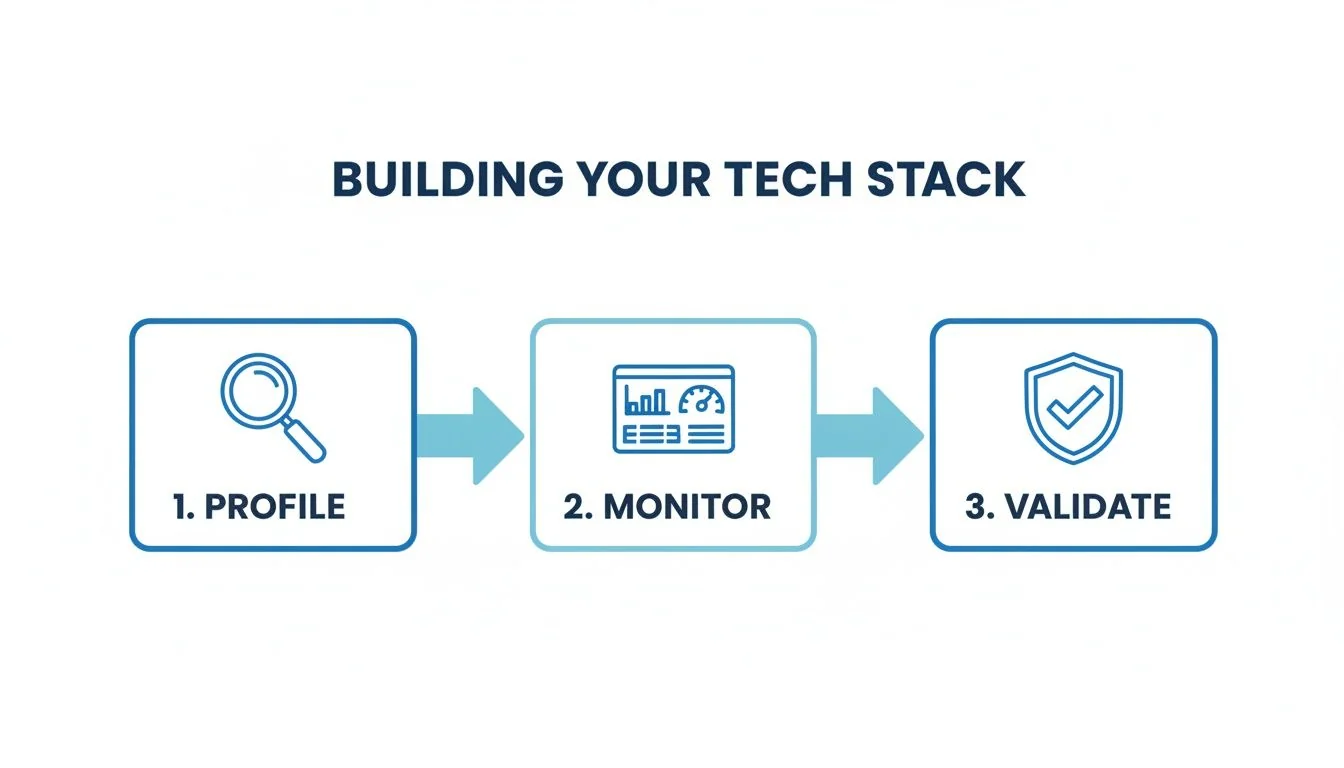
This flow illustrates how to embed quality throughout your stack.
Data quality is a continuous loop: profile the data to understand it, monitor it for anomalous behavior, and validate it against defined rules.
Two of the most powerful tools for proactive prevention are schema validation and data contracts.
- Schema Validation: This is a fundamental guardrail. Before a pipeline ingests data from a new source, it should automatically verify the structure. Are all required columns present? Are the data types correct? This single step can prevent a large number of common ETL failures.
- Data Contracts: A data contract is a formal, machine-readable agreement between a data producer (e.g., a backend application team) and a data consumer (e.g., the analytics team). It defines not only the schema but also the semantic rules and quality guarantees. For example, a contract might legally bind the producer to ensure the
order_totalfield is always a positive number.
Scenario: A Critical API Feed Fails
Consider a real-world example. An e-commerce platform relies on a critical API feed from a third-party shipping provider.
An automated dbt test, which runs on every data load, fails. The test was written to ensure the shipping_status column contained only four specific values: ‘shipped’, ‘in_transit’, ‘delivered’, or ‘delayed’. The failure is caused by a new, undocumented value: ‘returned’.
A well-defined playbook ensures a systematic response:
- An alert automatically creates a Jira ticket and assigns it to the Logistics Data Steward.
- The data lineage tool instantly identifies 12 downstream dashboards and a key inventory forecasting model as affected.
- The Data Steward investigates and confirms the new ‘returned’ value is legitimate.
- The immediate fix is to update the dbt test to accept the new status, unblocking the pipeline and restoring the dashboards.
- The long-term fix involves the Data Steward working with engineering to update the data contract with the shipping provider. This ensures future API changes are communicated and tested before they are deployed to production.
This systematic response turns a potential crisis into a routine operational task and reinforces a culture of shared responsibility for data health.
Building the Right Team to Drive Your Program
Technology alone cannot solve data quality problems. The most sophisticated monitoring stack is useless without skilled people to operate it. A successful data quality program requires a dedicated team with clearly defined roles, authority, and a well-defined collaborative process.
Investing in people is as critical as investing in software. Many data quality programs fail because they lack the necessary organizational structure and fail to gain traction outside of the data team.
Assembling Your Core Data Quality Team
A mature data quality program is a collaborative effort. While job titles may vary, the core functions are universal. You need individuals who understand the business context, those who can implement technical solutions, and those who can bridge the gap between the two.
These are the essential roles:
- Data Owner: An executive sponsor, such as a VP of Marketing or Head of Finance, who is ultimately accountable for the quality of data within their domain. They do not manage data day-to-day but control the budget, set strategic priorities, and own the business outcomes tied to that data.
- Data Steward: Subject-matter experts from the business who are responsible for defining data quality rules, managing metadata, and leading remediation efforts for specific data assets, such as customer or product data.
- Data Quality Analyst: A technical role focused on implementation. The analyst uses profiling and monitoring tools to proactively identify issues, build data quality dashboards, and perform root-cause analysis. They collaborate with engineers to implement fixes.
Effective collaboration between these roles is key. A Data Steward might identify an issue with inconsistent customer addresses. The Data Quality Analyst then quantifies the problem’s scope and traces it to a faulty API integration. The steward then presents this evidence to the Data Owner to prioritize a fix, creating a closed-loop system of accountability.
The Build vs. Buy Decision for Expertise
Once you have defined the roles, you must decide whether to build this expertise in-house or hire an external partner. The optimal path depends on your organization’s urgency, budget, and existing talent.
Building In-House
This is the ideal long-term solution. An internal team possesses deep institutional knowledge and is fully dedicated to your company’s mission. However, hiring, training, and retaining top-tier data talent is a slow, expensive, and competitive process. It can take 12-18 months to build a fully functional team from scratch.
Buying Expertise (Consultancies)
Engaging a specialized data engineering consultancy can accelerate your program. These firms provide pre-built frameworks, experience with platforms like Snowflake or Databricks, and a team of experts ready to start immediately. This is often the best approach when you need to demonstrate results quickly to secure long-term funding and executive support.
The “build vs. buy” decision is not mutually exclusive. A hybrid strategy is often effective. A consultancy can launch the program, establish best practices, and train your internal team, with ownership gradually transitioning over a 6-12 month period.
How to Select the Right Consultancy Partner
If you decide to hire external help, the selection process is critical. The wrong partner can waste your budget and set your program back. A structured evaluation is necessary to assess firms based on tangible evidence. Our guide on hiring a data governance consultant provides a deeper dive into this process.
Your Request for Proposal (RFP) or evaluation checklist should focus on proven outcomes.
Condensed Consultancy RFP Checklist:
| Category | Key Evaluation Criteria |
|---|---|
| Technical Expertise | Do they have certified experts on your specific data platform (e.g., Snowflake, Databricks)? Can they show proven experience with modern DQM frameworks and tools? |
| Delivery Quality | Demand case studies with measurable outcomes. What was the data quality score improvement? How did they reduce data-related support tickets? |
| Methodology | What’s their playbook for a data quality assessment? How do they structure remediation sprints and, crucially, knowledge transfer to your team? |
| Industry Experience | Have they solved these exact data quality problems for other companies in your industry (e.g., finance, healthcare, e-commerce)? |
| Team Composition | Will you be working with a senior team, or will your project be staffed with junior analysts? Always ask for the bios of the actual project team. |
Selecting the right people—whether internal hires or external partners—is the most important decision you will make. It is the human element that transforms a collection of tools and rules into a program that delivers lasting business value.
Even with the best strategy, implementing a data quality program presents challenges. Moving from theory to practice inevitably raises common roadblocks and difficult questions. Let’s address the most frequent ones.
This is a field guide for the crucial conversations that will determine your program’s success.
Where Do We Start for the Biggest Impact?
The common mistake is to try to fix everything at once. This approach guarantees failure, as resources become too thinly spread to show meaningful progress.
A surgical approach is required.
Identify a critical business process that is actively hindered by poor data, such as customer onboarding, financial reporting, or supply chain forecasting. Focus on one. Then, identify the 5-10 Critical Data Elements (CDEs) essential for that single process.
Concentrate your initial efforts on profiling, monitoring, and cleaning only those CDEs. When you can demonstrate a clear win—“We reduced wasted marketing spend by preventing 10,000 undeliverable mailings”—you create a powerful success story. This is how you earn the trust, political capital, and funding to expand the program.
How Do We Get Business Teams to Care?
Discussions about “null values” or “schema drift” will not engage business partners. They care about meeting their targets. To get their attention, you must translate data quality issues into the language of business impact and financial outcomes.
Don’t say: “We have a 15% null rate in the address field.”
Do say: “We are wasting $50,000 per campaign sending marketing materials to invalid addresses.”
Frame every data quality conversation around their specific goals and KPIs. Build simple dashboards that directly link data quality scores to the business metrics they own. Assign a business-side Data Steward responsibility for that score. When a sales director sees a direct correlation between incomplete lead records and a declining sales forecast, they become your strongest advocate.
Data quality ceases to be a “tech problem” and becomes a business priority the moment you frame it as a direct obstacle to achieving business goals.
What Is a Data Contract and Why Is It So Important?
A data contract is a formal, machine-readable agreement between a data producer (e.g., an application’s API) and a data consumer (e.g., your analytics team). It functions as a strict API for your data, specifying the exact schema, semantics, and quality rules.
Its primary function is to prevent downstream failures.
For example, if a developer attempts to rename a column or change a data type, the data contract automatically validates the change. If it is a “breaking change” that would disrupt a downstream dashboard, the deployment fails. This addresses the problem at the source, preventing a late-night incident for the data team.
Adopting data contracts is a significant step toward a proactive, “shift-left” approach to data quality and is foundational for building reliable data systems.
Should Data Quality Be Centralized or Decentralized?
The most effective model is a hybrid one, often referred to as a federated approach.
A fully centralized data quality team creates a bottleneck, as it cannot possess the business context for every department. Conversely, a completely decentralized approach leads to inconsistent standards and duplicated efforts.
A federated model combines the advantages of both:
- A Central Team (e.g., within your Data Governance or Platform group) sets standards, provides tools and playbooks, and serves as internal experts.
- Decentralized Ownership resides within the business domains. A Data Steward from Marketing owns the quality of customer data, while a counterpart in Finance is accountable for financial transaction data.
This structure provides the efficiency of a common toolset with the domain-specific knowledge required for intelligent decision-making. It fosters a culture of shared responsibility, which is the ultimate goal.
Achieving high data quality requires the right strategy, tools, and people. If you need to accelerate your program and find an expert partner, we can help. At DataEngineeringCompanies.com, we provide independent firm profiles and comparison tools to help you select a data engineering consultancy with confidence. Explore the directory.
Researched & written by
Data-driven market researcher with 20+ years in market research and 10+ years helping software agencies and IT organizations make evidence-based decisions. Former market research analyst at Aviva Investors and Credit Suisse.
Previously: Aviva Investors · Credit Suisse · Brainhub · 100Signals
Vetted partners
Top Data Governance Partners
Vetted firms whose specialty matches this article.
More in Data Governance
Data Reliability Engineering A Guide for CTOs
Learn what Data Reliability Engineering (DRE) is, why it matters, and how to implement it. A complete guide for leaders evaluating data engineering partners.
Data Lakehouse vs Data Mesh: A 2026 Decision Guide
Choose the right architecture for your enterprise. A detailed comparison of data lakehouse vs data mesh on cost, governance, performance, and vendor selection.
Data Catalog Tools Comparison for Engineering Leaders
Data catalog tools comparison - For engineering leaders: This data catalog tools comparison provides a deep dive into Alation, Collibra, Atlan, & Informatica. S