Practical Data Analytic Strategies That Drive Business Outcomes
A data analytics strategy is a systematic plan for converting raw data into a measurable business advantage. It is not a passive exercise in data collection; it is an active blueprint that dictates how an organization collects, processes, analyzes, and acts on data to achieve specific business objectives. This framework is built on four core methodologies: Descriptive, Diagnostic, Predictive, and Prescriptive analytics.
Understanding the Core Data Analytic Strategies
A functional data analytics strategy operates like a clinical diagnosis. A physician does not rely on a single symptom; they aggregate a comprehensive dataset—symptoms, patient history, lab results—to understand the full clinical picture before prescribing a treatment. Business data requires the same rigorous, systematic approach.
This strategic imperative is no longer optional. As of late 2025, data analytics is a core operational function, not a fringe activity. The global data analytics market, valued around USD 91.4 billion in 2025, is projected to expand to USD 584.2 billion by 2034, reflecting its deep integration into corporate strategy. Data is no longer a byproduct of business operations—it is the primary driver of competitive differentiation and operational efficiency.
Effective implementation requires a clear understanding of the four fundamental types of analytics. Each answers a distinct business question, and they build upon one another to form a comprehensive decision-making framework.
The Four Core Data Analytic Strategies
The four core strategies provide distinct lenses for interpreting data, progressing from historical review to future-oriented, actionable recommendations.
Here is a functional breakdown:
| Strategy Type | Key Question Answered | Primary Goal | Example Use Case |
|---|---|---|---|
| Descriptive | ”What happened?” | To summarize historical data and establish a factual baseline of past performance. | A sales dashboard detailing last quarter’s revenue, broken down by region and product. |
| Diagnostic | ”Why did it happen?” | To perform root cause analysis by examining relationships and dependencies within the data. | Analyzing web traffic logs and CRM data to determine why a marketing campaign underperformed. |
| Predictive | ”What is likely to happen?” | To forecast future outcomes by applying statistical models and machine learning to historical data. | Using a regression model to identify customers with a high probability of churning in the next 30 days. |
| Prescriptive | ”What should we do about it?” | To recommend specific, optimized actions to achieve a desired outcome or mitigate a predicted risk. | An algorithm suggesting the optimal discount to offer a specific customer to prevent churn. |
These strategies form a logical progression. Analysis begins with understanding past events, investigates the causal factors, and then uses that understanding to forecast and influence future outcomes.
From Hindsight to Foresight
The initial two strategies, Descriptive and Diagnostic, are retrospective. Descriptive Analytics establishes the foundation by answering, “What happened?” It summarizes past data through standard business reports, such as a dashboard showing quarterly sales figures or a report detailing daily website visitors. It provides the “what” necessary to ask “why.”
Diagnostic Analytics then asks, “Why did it happen?” Once an event is identified, the next step is to determine its cause. If sales declined last month (Descriptive), a diagnostic analysis might reveal a correlation with a competitor’s promotional launch or a technical failure in the e-commerce checkout process.
The transition from hindsight to insight begins here. Knowing what occurred is informational; understanding the causal factors provides the leverage needed to implement corrective actions.
Shaping Future Outcomes
The next two strategies shift the focus from reacting to the past to proactively shaping the future. They represent a higher level of analytical maturity and are the source of significant competitive advantage.
Predictive Analytics asks, “What is likely to happen?” This approach uses historical data, statistical algorithms, and machine learning to generate probabilistic forecasts. Common applications include forecasting inventory requirements, predicting customer churn, or scoring sales leads based on their likelihood to convert.
Finally, Prescriptive Analytics provides the most advanced level of insight by answering, “What should we do about it?” It moves beyond prediction to recommend specific actions to optimize outcomes. A prescriptive model might suggest the ideal discount to prevent a high-value customer from churning or calculate the most fuel-efficient delivery route based on real-time traffic and weather data.
An effective data strategy does not operate in a single category. It creates an integrated system where descriptive data informs diagnostic analysis, which in turn fuels predictive models that generate actionable, prescriptive recommendations.
Understanding these four pillars is the first step toward building a sophisticated data analytics capability. A robust strategy integrates elements from each, enabling an organization to move beyond historical reporting and begin actively shaping its future. For a deeper technical guide, see this article on building a successful data analysis strategy.
How to Assess Your Analytics Maturity
Before developing a data strategy, a realistic assessment of your current capabilities is essential. Attempting to implement advanced AI when foundational data is unreliable is analogous to constructing a high-rise on an unstable foundation—it is destined for failure.
An objective assessment of your organization’s analytics maturity is not about assigning blame; it is about establishing a clear operational baseline. This diagnostic identifies areas of strength and, more critically, the specific bottlenecks hindering progress. A clear starting point allows for targeted investments in people, processes, and technology that will yield measurable improvements.
The Three Stages of Analytics Maturity
Most organizations fall into one of three distinct stages. Identifying your current stage is the first step toward creating a strategy that is both ambitious and achievable.
-
Foundational (Reactive): At this stage, data is typically fragmented, inconsistent, and often untrusted. Analytics consists of basic historical reporting, such as generating weekly sales figures. This is the domain of Descriptive Analytics, answering, “What happened?” Decisions are largely based on intuition, with data used primarily to confirm existing assumptions.
-
Developing (Proactive): Organizations at this stage have begun to centralize data and establish basic governance. They are moving beyond simple reporting into Diagnostic Analytics to ask, “Why did it happen?” Teams are beginning to connect disparate data sources to perform root cause analysis, such as correlating a sales decline with a specific marketing campaign’s failure. There is a demand for data-driven insights, but capabilities are not yet consistent across the enterprise.
-
Advanced (Strategic): At this level, data is managed as a core strategic asset. These organizations possess robust data infrastructure, skilled technical teams, and a data-centric culture. They have mastered Predictive and Prescriptive Analytics, using data to actively influence future outcomes. This is where data science and machine learning models are used to forecast customer churn, optimize supply chains in real time, and recommend next-best actions.
Progressing through these stages sequentially is critical. Each level builds upon the last, creating a stable platform for more sophisticated analytics. Attempting to bypass foundational stages is a primary cause of failed projects and wasted investment.
This hierarchy illustrates the progression from basic historical reporting to advanced, forward-looking recommendations.
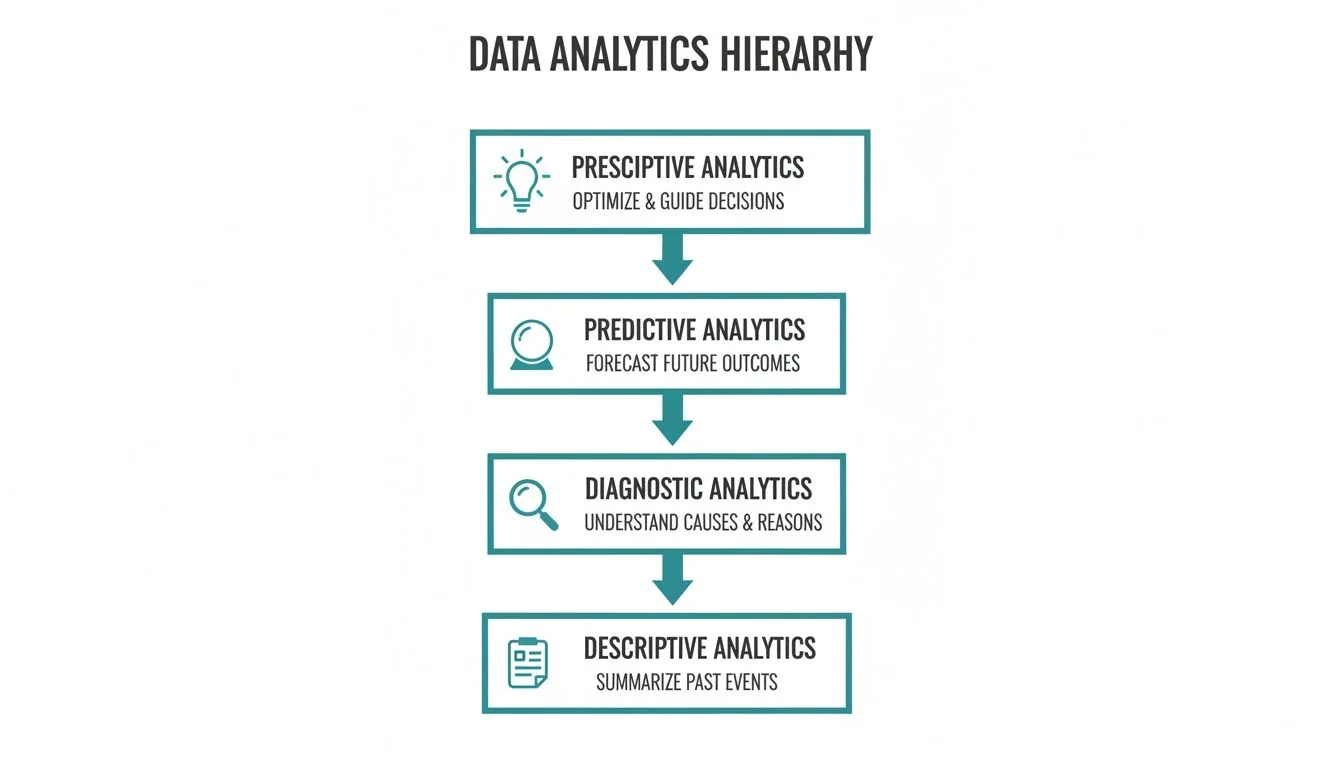
Moving up the pyramid from Descriptive to Prescriptive analytics increases both the technical complexity and the strategic value of the insights generated.
Pinpointing Your Position
To determine your organization’s position, conduct a rigorous assessment of these four areas:
- Data & Infrastructure: Is data consolidated in a centralized data warehouse or lakehouse, or is it dispersed across numerous spreadsheets and legacy systems? Is the data trusted by business users?
- People & Skills: Are there dedicated data professionals, such as engineers and analysts? Are business teams capable of interpreting data, or does every query require an IT ticket?
- Process & Governance: Is there a formal data governance policy? Are key metrics and KPIs defined consistently across the organization, or does each department use its own calculations?
- Business Integration: Are analytics integrated into daily operational workflows? Do leaders consistently use data to inform strategic decisions, or is it an afterthought?
This growth trajectory explains why large enterprises command over 54% of market revenue; they have developed the capabilities to manage vast and complex datasets from IoT devices, social media, and numerous customer touchpoints. The software segment alone is projected to constitute 67.80% of the market in 2025, highlighting the critical role of appropriate tooling. You can examine further market insights on data analytics adoption on Precedence Research.
Answering these questions objectively will provide a clear understanding of your current maturity level and highlight the specific gaps that must be addressed. This self-assessment forms the basis for constructing a practical and effective analytics roadmap.
Creating Your Analytics Roadmap
While the maturity model defines your current state, the analytics roadmap provides the tactical plan to reach your desired future state. This is not an abstract exercise; it is a step-by-step plan that directly links data initiatives to specific business outcomes, ensuring that all investments are justifiable and ROI-positive.
A common failure pattern is beginning with technology. Organizations become enamored with a new AI platform or visualization tool, bypassing the critical first question: “What specific business problem are we trying to solve?” An effective roadmap inverts this approach, always beginning with business objectives, not with technology.
Begin with Business Goals
The first step is to engage business leaders from all major functions—sales, marketing, operations, and finance. The objective is to identify their most significant operational challenges, bottlenecks, and untapped growth opportunities.
The critical skill here is translating these business problems into precise, answerable analytical questions. The process is as follows:
- Business Problem: “We are experiencing unacceptable levels of customer churn, and we don’t know why.”
- Analytical Question: “Can we develop a predictive model to identify customers with the highest probability of churning within the next 30 days and determine the specific interventions most likely to retain them?”
This translation is fundamental. It ensures that all analytics work is directly tied to a tangible business need, which is essential for securing executive sponsorship and funding. Without this linkage, data projects risk becoming costly research experiments with no clear ROI.
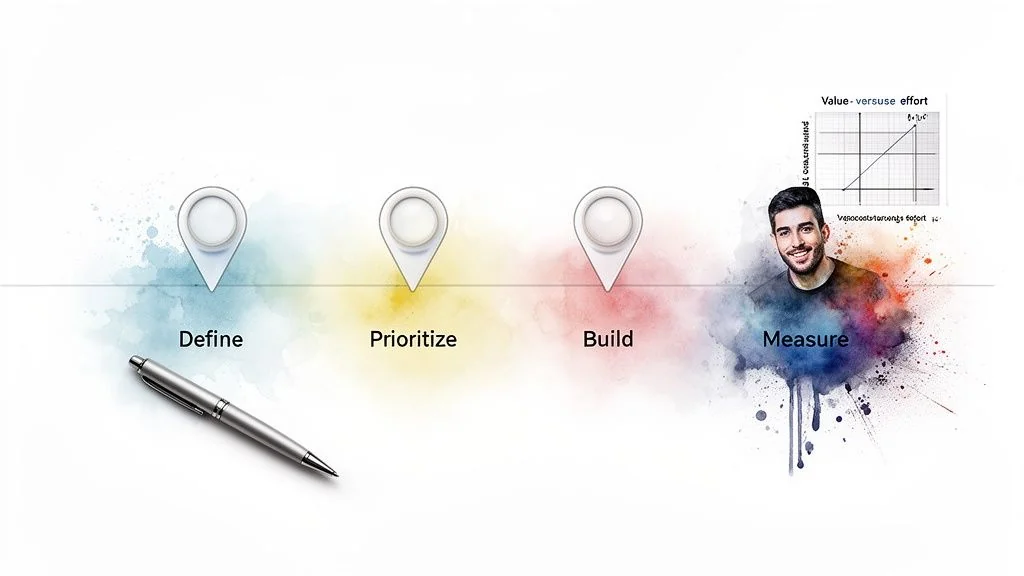
Prioritize with a Value vs. Effort Matrix
With a list of potential projects, a prioritization framework is necessary. A value versus effort matrix is a simple and effective tool for this purpose.
Plot each potential project on a two-by-two grid based on these four quadrants:
- High-Value, Low-Effort (Quick Wins): These projects should be prioritized immediately. They deliver significant impact with minimal resource expenditure, building early momentum and demonstrating value.
- High-Value, High-Effort (Major Projects): These are strategic initiatives that require substantial investment but offer transformative returns. They should be planned meticulously and executed in manageable phases.
- Low-Value, Low-Effort (Fill-Ins): Address these projects opportunistically when resources are available, but do not allow them to divert focus from higher-priority initiatives.
- Low-Value, High-Effort (Avoid): These projects are resource sinks with minimal business benefit and should be avoided.
This framework imposes a disciplined, objective conversation about priorities and prevents the team from becoming bogged down in low-impact activities.
Effective prioritization is crucial. As noted, the global data analytics market is on a steep growth curve. This rapid expansion means resources must be allocated efficiently to initiatives with the highest potential return. You can discover more insights on the data analytics market on IMARC Group for a complete market analysis.
A Real-World Roadmap Example
Consider a mid-sized retail company facing chronic stockouts of popular items while other products remain overstocked.
-
Phase 1 (Quick Win - Q1): The team begins with a low-effort project: a descriptive analytics dashboard integrating inventory levels, sales data, and supplier lead times. This provides immediate visibility into the most problematic products and locations. Value: High. Effort: Low.
-
Phase 2 (Major Project - Q2/Q3): The success of the dashboard provides the credibility to tackle a more complex problem. The team develops a diagnostic tool to analyze historical data and identify the root cause of the stockouts: a key supplier with consistently late deliveries. Value: High. Effort: Medium.
-
Phase 3 (Strategic Initiative - Q4): Building on previous successes, the team develops a predictive forecasting model using machine learning to anticipate customer demand. This enables a shift from a reactive to a proactive inventory management strategy. Value: Very High. Effort: High.
This phased approach delivered measurable value at each stage, simplifying the process of securing approval for subsequent phases. By starting with a quick win and demonstrating ROI, the team built the organizational trust required to pursue more advanced data analytic strategies. The roadmap serves as the operational playbook for converting a strategic vision into a series of concrete, value-driven accomplishments.
Building Your Analytics Dream Team and Tech Stack
An analytics strategy is inert without the right people and technology to execute it. Insights are not conjured; they are the output of a well-designed engine of talent, processes, and platforms that transforms raw data into a competitive asset.
A common misstep is assuming a single “rockstar” data scientist can solve all problems. In reality, a high-performing analytics function is an interdisciplinary team with specialized, complementary roles. Similarly, the optimal technology stack is not the most fashionable one; it is the one that best supports your business goals and current analytical maturity.
Assembling the Right Talent
The search for a “unicorn”—an individual who can build data pipelines, develop complex machine learning algorithms, and effectively communicate with the C-suite—is unrealistic. A more pragmatic and effective approach is to build a team with distinct, specialized skill sets.
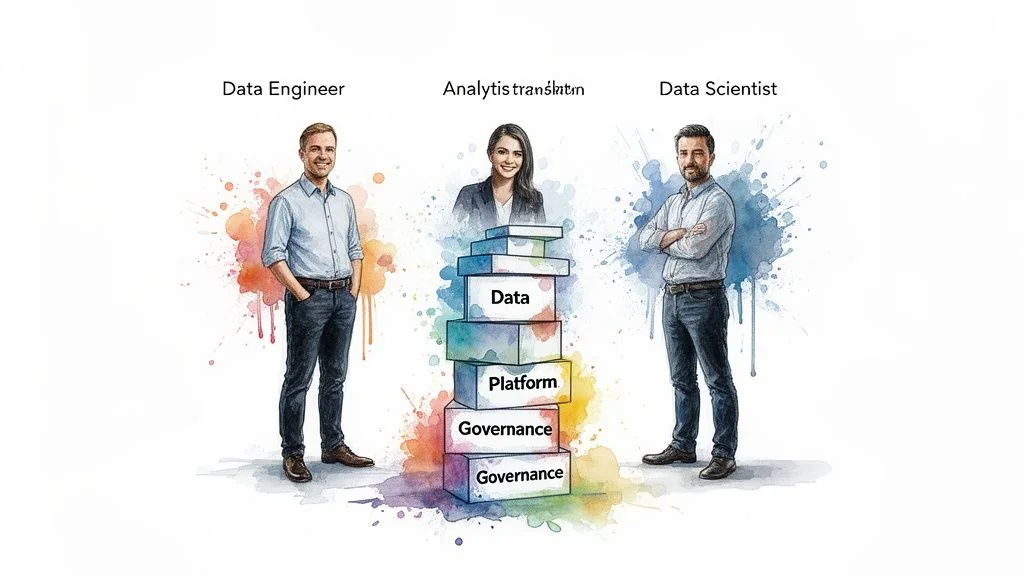
- Data Engineers: These professionals are the architects of the data infrastructure. They build and maintain the data warehouses, pipelines, and transformation processes that ensure data is reliable, accessible, and performant. Without competent data engineering, analysts and scientists are forced to work with poor-quality data, which undermines all subsequent analysis.
- Data Analysts & Analytics Translators: This group serves as the critical interface between the technical and business domains. Data Analysts are proficient in querying data, building dashboards, and uncovering initial insights. Analytics Translators are skilled communicators who reframe business problems into answerable analytical questions and translate complex model outputs back into actionable business language.
- Data Scientists: Once the data is clean, organized, and accessible, data scientists apply advanced statistical and machine learning techniques to build predictive and prescriptive models. They answer forward-looking questions: “What will happen next?” and “What is the optimal action?”
The effectiveness of an analytics team is determined by its balance, not its size. A single data engineer supporting five analysts can often deliver more immediate business value than a team of isolated data scientists contending with inadequate data infrastructure.
Capabilities You Need at Each Analytics Maturity Stage
Aligning talent, processes, and technology with your current maturity stage is crucial to avoid over-investing in capabilities you are not prepared to use. This table serves as a practical checklist for each step of the journey.
| Maturity Stage | People (Key Roles) | Process (Core Focus) | Platform (Technology Needs) |
|---|---|---|---|
| 1. Foundational | Data Analyst, Business Analyst, “Accidental” Analyst | Manual reporting, ad-hoc queries, basic data pulls | Spreadsheets (Excel, Google Sheets), basic BI tools (e.g., Power BI) |
| 2. Centralized | Data Engineer, BI Developer, Analytics Manager | Centralized data warehouse, standardized dashboards, data governance | Cloud Data Warehouse (Snowflake, BigQuery), ETL/ELT Tool (Fivetran) |
| 3. Advanced | Data Scientist, Analytics Translator, ML Engineer | A/B testing, predictive modeling, data product development | BI/Visualization (Tableau), Data Transformation (dbt), ML platforms |
| 4. Optimized | Full cross-functional teams, Analytics Evangelists | Embedded analytics, automated decision-making, self-service | Real-time streaming platforms, MLOps tools, integrated data stack |
This framework helps prioritize investments. If your organization is in the Foundational stage, the first strategic hire should be a data engineer or a skilled analyst, not a PhD-level data scientist.
Choosing Your Technology Stack
Technology selection should align with your analytics maturity and roadmap. A startup does not require the same enterprise-grade infrastructure as a global corporation deploying real-time prescriptive models. The objective is to select tools that solve current problems while providing a clear path to scale.
The modern data ecosystem is dominated by flexible, cloud-based platforms. These tools offer significant power and scalability without the high capital expenditures and maintenance overhead of legacy on-premise systems.
The core components of a modern data stack include:
- Data Ingestion & Integration: Tools like Fivetran or Stitch automate the process of extracting data from various sources (SaaS applications, databases, event streams) and loading it into a central repository.
- Data Storage & Warehousing: Cloud platforms such as Snowflake, Databricks, and Google BigQuery are the industry standards for storing and processing large volumes of data efficiently.
- Data Transformation: Once raw data is in the warehouse, it must be cleaned, modeled, and prepared for analysis. dbt (Data Build Tool) is a widely adopted tool for applying software engineering best practices to this process.
- Business Intelligence & Visualization: Platforms like Tableau, Microsoft Power BI, and Looker enable business users to explore data, create interactive dashboards, and share insights across the organization.
To understand how these components interoperate, you can explore the components of a modern data stack. The goal is to build a cohesive ecosystem where each tool performs a specific function, working in concert to convert raw data into a strategic business asset.
How to Measure Analytics ROI
Eventually, every analytics leader must justify their team’s value in financial terms. This is not merely a technical reporting exercise; it is a critical business function. Without a clear, quantifiable link between analytics work and financial outcomes, budgets are perpetually at risk.
The key is to shift the conversation from technical metrics to the language of the C-suite: revenue, cost, and risk.
Metrics like query performance or the number of dashboards built are indicators of activity, not impact. To secure ongoing investment, every analytics project must be tied directly to a core business objective. This shift in perspective is what elevates an analytics function from a cost center to a value-generating engine.
Tying Analytics to Business Outcomes
To calculate ROI, “return” must be defined in the context of a specific business objective. The goal is to connect an analytical insight to a measurable change in a key performance indicator (KPI) that the business already monitors. This direct linkage is essential for communicating value.
This involves translating technical achievements into business impact. For example, instead of stating, “We built a churn prediction model with 92% accuracy,” present the outcome as: “Our new model identified $1.2 million in at-risk revenue, enabling the retention team to proactively save 15% of those customers through targeted interventions.” The second statement quantifies the financial impact in universally understood terms.
A powerful framework for this is to classify the impact of all projects into one of three categories. This structures value conversations and ensures every initiative has a clear financial justification from its inception.
- Growing Revenue: Projects that directly increase top-line revenue, such as identifying cross-sell opportunities, optimizing pricing strategies, or improving customer lifetime value (CLV).
- Reducing Costs: Initiatives focused on operational efficiency, such as optimizing supply chain logistics, reducing fraudulent transactions, or automating manual reporting processes that consume significant man-hours.
- Mitigating Risk: The use of analytics to avoid potential financial losses, such as improving demand forecasting to prevent inventory overstocking or enhancing compliance monitoring to avoid regulatory penalties.
Framing every project within one of these three buckets shifts the conversation from technical details to the financial metrics that drive executive decision-making. It preemptively answers the question, “So what?”
A Practical ROI Calculation Framework
Consider a retail company using analytics to optimize its marketing spend.
- Define the Business Goal: The objective is to reduce the customer acquisition cost (CAC) without compromising lead quality.
- Launch the Analytics Initiative: The data team develops a predictive model that identifies the marketing channels delivering the highest-value customers. Based on these insights, the marketing team reallocates $500,000 of its budget from underperforming channels to top-performing ones.
- Measure the Business Outcome: In the following quarter, the company’s overall CAC decreases by 20%, resulting in a direct cost saving of $450,000.
- Calculate the ROI: The total cost of the project was $50,000 (analyst salaries, cloud computing resources, etc.). The ROI is calculated using the standard formula:
(Net Profit / Cost of Investment) x 100.
- Calculation:
(($450,000 - $50,000) / $50,000) x 100 = 800%
Presenting an 800% ROI in a budget meeting is how an analytics team justifies its existence and secures funding for future initiatives. This transforms the perception of data analytic strategies from a necessary expense into a high-yield investment for the entire organization.
Choosing the Right Data Engineering Partner
Building a high-performing analytics function internally is a substantial undertaking that requires specialized skills, significant capital, and considerable time. Consequently, many organizations partner with specialized data engineering firms to accelerate their roadmap and access expert talent.
Selecting the right partner is a critical decision. A strong partner acts as a strategic extension of your team, providing both technical execution and advisory services. A poor choice can result in project delays, significant technical debt, and a loss of organizational confidence in data initiatives.
Looking Beyond the Sales Pitch
When evaluating potential partners, it is essential to look past marketing claims and assess actual capabilities. Technical proficiency is a baseline requirement. The key differentiators are deep, proven expertise in your chosen data platform—such as Snowflake or Databricks—and a demonstrable track record within your industry.
The objective is not simply to hire developers, but to engage a partner who understands your business context and can directly map technical solutions to your specific operational problems.
Independent resources that provide ranked lists and detailed profiles of data engineering firms can be invaluable in this process, helping to clarify a firm’s core competencies and industry focus.
This type of comparative analysis is crucial for moving beyond marketing materials and evaluating a firm’s real-world capabilities and relevant experience.
Critical Questions for Your Shortlist
To make an informed decision, you must ask targeted questions that reveal a firm’s operational practices. Key evaluation points include:
- Technical and Platform Expertise: How many certified professionals do you have for platforms like Snowflake or Databricks? Provide examples of projects that match our required scale and complexity.
- Industry and Domain Knowledge: What is your experience in our industry? Share a case study where you solved a business problem similar to ours for another company in our sector.
- Project Methodology and Governance: What is your project management methodology? What is your communication cadence, and how do you manage scope changes? What is your plan for knowledge transfer to our internal team?
- Cultural Fit and Collaboration: How will your team integrate with ours on a day-to-day basis? Describe your approach to co-development and training to ensure our team can maintain and evolve the platform independently post-engagement.
The value of a partner is measured not just by what they build, but by the capabilities they leave behind. The best firms prioritize enablement, ensuring your own team develops the skills to own the data platform long after the initial engagement concludes.
A thorough partner selection process is a strategic investment. For a more detailed checklist, see this guide on optimizing your data services RFP process. A well-vetted decision at this stage will yield significant returns over the long term.
Frequently Asked Questions
These are common, practical questions that arise when implementing a data analytics strategy.
Data Analytics vs. Business Intelligence
What is the functional difference between data analytics and business intelligence (BI)? BI is primarily retrospective, while data analytics is prospective.
BI focuses on answering “what happened and why” by using historical data to generate dashboards and reports on past performance. Data analytics uses that same data to predict “what will happen next” and recommend actions to optimize future outcomes. BI provides hindsight; analytics provides foresight.
Starting with Poor Data Quality
How can we start an analytics initiative if our data quality is poor? This is a common obstacle that often leads to inaction. The key is to avoid “boiling the ocean” by attempting to clean all data at once.
Instead, select a single, high-value pilot project. Concentrate efforts on cleaning only the data required for that specific initiative. The success of this pilot will provide a tangible win and a strong business case for a more comprehensive data governance program.
The objective is to demonstrate ROI from a small, controlled dataset. This success creates the political capital needed to secure investment in broader data infrastructure and quality improvements, reframing a technical issue as a clear business opportunity.
Building Your Team In-House or Outsourcing
Should we build our analytics team internally or outsource? For most organizations, the optimal solution is a hybrid model that combines both.
This typically involves:
- Engaging external partners to accelerate the build-out of the core data platform and provide specialized expertise for initial complex projects. This significantly reduces the time-to-value.
- Enabling your internal team to focus on business context, drive user adoption, and ensure that the analytical outputs are directly solving real-world business problems.
This strategy leverages the best of both worlds: external expertise and speed combined with deep internal business knowledge. It is a pragmatic approach to building long-term capabilities while delivering short-term results.
Selecting the right partner is a critical first step. At DataEngineeringCompanies.com, we provide independent, data-backed rankings and tools to help you choose the right data engineering consultancy with confidence. Start your search today.
Data-driven market researcher with 20+ years in market research and 10+ years helping software agencies and IT organizations make evidence-based decisions. Former market research analyst at Aviva Investors and Credit Suisse.
Previously: Aviva Investors · Credit Suisse · Brainhub · 100Signals
Top Data Engineering Partners
Vetted experts who can help you implement what you just read.
Related Analysis
A Leader's Guide to Apache Spark Optimization: Moving Beyond Quick Fixes
Unlock performance with apache spark optimization strategies for faster jobs, smarter tuning, and cost savings across your data platform.
Data Contracts in Data Engineering: A Guide for Engineering Leaders
Explore data contracts in data engineering to enforce agreements, prevent pipeline failures, and boost data reliability across Snowflake and Databricks.
A Data Lineage Tools Comparison Framework for Engineering Leaders
Cut through the noise with this data lineage tools comparison. Evaluate top vendors on architecture, integration, and pricing for your modern data platform.