A Practical Guide to the Modern Architecture of a Data Warehouse
architecture of a data warehouse, data warehouse layers, cloud data warehouse, lakehouse architecture, data engineering
A data warehouse is not a scaled-up operational database. It is an analytical system built for one job: turning raw data into reliable, fast-to-query business insight. It holds historical and current data in a structure built for analysis, creating a single source of truth that keeps analytical workloads off the transactional systems the business runs on.
What does a modern data warehouse architecture actually do?
A modern data warehouse sits at the center of an organization’s analytical capability. It ingests data from disparate sources - CRMs, ERPs, application databases, event logs - and turns it into a queryable format. Of the 86 firms profiled in the Data Engineering Companies Index, 66 list Snowflake among the platforms they build this kind of architecture on.
Raw data from operational systems (Salesforce, PostgreSQL, and similar tools) is ingested, cleansed, standardized, and organized across logical layers. The structured result then flows out through BI dashboards, reporting tools, and data science platforms, so decision-makers can query and analyze it directly instead of waiting on a report cycle.
This architecture moves past passive storage into an active analytics engine. Its goal is a unified view of the business, built to handle complex analytical queries over large datasets without slowing down the source operational systems it draws from.
Why are companies modernizing their data warehouse architecture?
Data volume keeps growing, and the business questions being asked of it keep getting more demanding. Legacy warehouses were built for scheduled reports, not for the kind of ad hoc, cross-system analysis that modern BI and AI/ML workloads require.
A modern architecture is designed to answer questions legacy systems struggle with:
- How does a customer’s website interaction journey correlate with their long-term value?
- Which marketing channels generate the highest lifetime value customers, not just initial conversions?
- What are the hidden inefficiencies in the supply chain that only integrated historical data can surface?
The value of a data warehouse lies not in data storage but in its structure. A well-designed architecture lets an organization use historical data to build predictive models, spot trends, and get ahead of operational issues instead of reacting to them.
What architectural principle matters most in a modern warehouse?
Legacy, on-premise data warehouses were rigid, slow, and expensive to scale. Modern, cloud-native architectures are built on elasticity, efficiency, and separation of concerns - the same principles behind the modern data stack.
The single most important principle is the separation of storage and compute. An organization can scale how much data it stores independently from how much processing power it pays for. A large influx of data can be ingested and stored (scaling storage) without triggering the cost of a high-performance processing cluster until a complex query actually runs (scaling compute). That’s what makes the model cost-efficient at scale.
What are the core layers of a data warehouse?
A data warehouse is a multi-layered system, not one monolithic application. Each layer does a specific job in the data lifecycle, moving raw data toward business intelligence. Data flows through a series of zones where it gets cleansed, integrated, and structured for analysis - a value chain running from raw, unprocessed data at the source layer to refined, actionable insight at the presentation layer.
This diagram shows the basic data flow: ingestion from various sources, processing and storage inside the warehouse, and consumption by end-users through analytical tools.
What sits in the data source layer?
This is the origination layer: every system that generates business-relevant data, spanning internal and external platforms.
Common data sources include:
- Transactional Databases: OLTP systems like PostgreSQL or MySQL that power core business applications and record daily operations.
- Cloud Applications: SaaS platforms such as Salesforce for CRM, Marketo for marketing automation, or Zendesk for customer support.
- Logs and Events: Machine-generated data from web servers, application logs, and IoT devices that capture user interactions, system errors, and other events.
Data in this layer is raw, often inconsistent, and spread across incompatible formats. The first challenge is simply establishing connectivity and extraction from each source.
What happens in the staging and integration layer?
After extraction, data lands in a staging and integration layer - the first processing zone, where transformation begins. In modern architectures following an ELT (Extract, Load, Transform) pattern, raw data loads directly into a dedicated staging area inside the cloud data warehouse.
This layer buffers the analytical environment from the inconsistencies of source data. Most of the core data engineering work happens here: cleansing, deduplication, and standardization.
Practical transformations in this layer include standardizing country codes (mapping “USA,” “U.S.A.,” and “United States” to a single canonical value) or enriching customer records by joining data from CRM and support ticket systems.
What does the storage and modeling layer do?
This is the core of the data warehouse, where cleansed, integrated data sits for long-term analysis. Unlike a transactional database built for write operations, this layer is optimized for high-speed read access across large datasets.
Data gets structured with specific modeling techniques to keep queries fast. The goal is a structure that’s intuitive for business users and computationally efficient for analytical tools, so queries come back in seconds instead of minutes.
How do you model data in a data warehouse?
Data modeling structures raw data into fact tables (quantitative measures) and dimension tables (descriptive context) built for analytical queries. The most common approach, dimensional modeling, organizes these into a star schema for fast BI performance, or a snowflake schema when storage efficiency and normalized dimensions matter more than raw query speed.
Beyond picking a schema shape, three decisions determine whether a model holds up under real use:
- Star vs. Snowflake Schema: A star schema denormalizes dimension tables - wide, with some data repetition - to minimize joins and maximize query speed, making it the default for BI-facing analytics. A snowflake schema normalizes those same dimensions into smaller, related tables, trading query speed for reduced redundancy and easier long-term maintenance.
- Defining the Grain: Before building a fact table, the first decision is its grain - a precise statement of what a single row represents (one line item on an order, or a daily summary of sales per store). An ambiguous grain produces inconsistent metrics and erodes trust in the data. For more on this, see our guide on data modeling techniques.
- Tracking Change with SCDs: Attributes like a customer’s address or a sales territory change over time. Slowly Changing Dimensions (SCDs) govern how that gets captured: Type 1 overwrites the old value, Type 2 adds a new row with an effective date to preserve history, and Type 3 adds a “previous value” column for direct before-and-after comparisons.
What lives in the analytics and presentation layer?
This is the user-facing layer where data becomes business value. It’s the set of tools and applications that analysts, data scientists, and business leaders use to interact with the data in the warehouse - submitting queries to the storage layer and visualizing what comes back.
Common components include:
- Business Intelligence (BI) Tools: Platforms like Tableau, Power BI, or Looker, which provide interactive dashboards and data visualization.
- Reporting Applications: Tools for generating static, standardized reports such as monthly sales summaries or quarterly financial statements.
- Data Science Platforms: Environments like Jupyter Notebooks that let data scientists work with curated datasets to build predictive models and run statistical analysis.
How well this layer works is ultimately what the whole architecture gets measured against - how easily it lets people turn data into decisions.
Core Data Warehouse Architectural Layers and Functions
| Layer | Core Function | Example Technologies & Processes |
|---|---|---|
| Data Source | The origination point for all raw business data. | Transactional databases (PostgreSQL, MySQL), SaaS apps (Salesforce), IoT sensors, logs. |
| Staging & Integration | A temporary holding and processing area for data cleansing, standardization, and integration. | Data ingestion tools (Fivetran, Airbyte), raw storage zones in a cloud warehouse (Snowflake, BigQuery). |
| Storage & Modeling | The central repository for cleaned, structured, and historically-tracked data optimized for analytics. | Cloud data warehouses (Snowflake, Redshift), data modeling (star/snowflake schemas), data marts. |
| Analytics & Presentation | The user-facing layer where data is queried, visualized, and consumed to generate insights. | BI tools (Tableau, Power BI), reporting software, machine learning platforms (Jupyter). |
Each layer builds on the one before it, forming a data pipeline that turns raw operational data into a usable business asset.
How do you choose the right data warehouse architectural blueprint?
Picking a data warehouse architecture is a strategic decision, not just a technical one. There’s no universally “best” design - the right choice depends on organizational scale, data latency requirements, and long-term data strategy. Whatever blueprint you pick will shape how data gets organized, accessed, and governed for years afterward.
Base this decision on an honest read of business needs, not on industry trends. A startup’s requirements for agile marketing analytics look nothing like a multinational’s requirements for governed financial reporting.
Kimball or Inmon: which modeling approach fits?
Modern cloud architectures are built on two classical methodologies that are still relevant today.
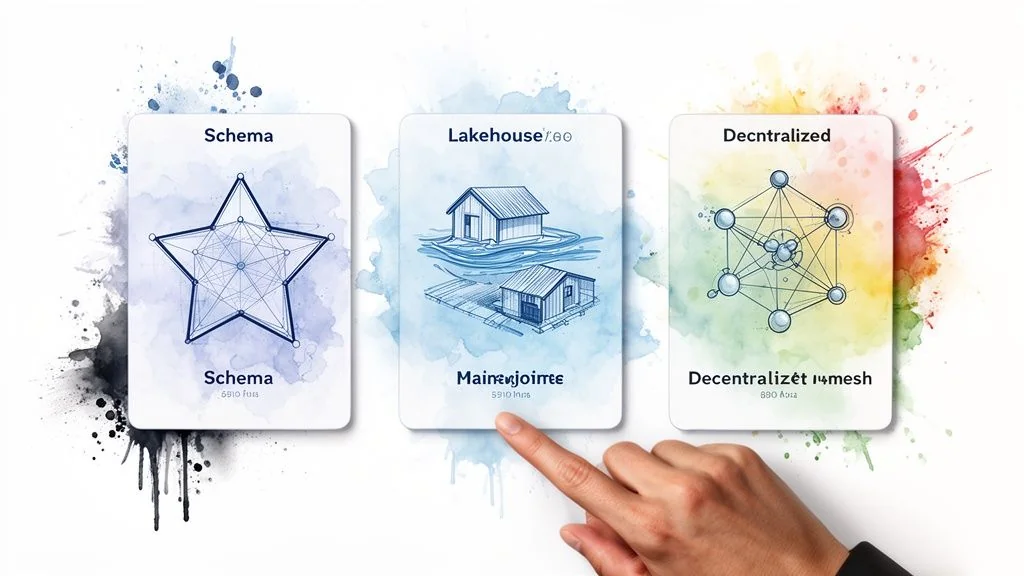
The Kimball method, developed by Ralph Kimball, is a “bottom-up” approach focused on getting business value out fast. It builds discrete, business-process-oriented data marts, typically using a star schema - a design with a central fact table (quantitative measures like sales revenue) surrounded by dimension tables (contextual attributes like customer, product, and date).
- Pros: Intuitive for business users and optimized for fast BI queries. Supports incremental development, so teams can deliver analytics for specific departments quickly.
- Cons: Integrating data across different data marts can get complex, and without strong governance it can lead to data silos or inconsistencies.
The Inmon method, developed by Bill Inmon, is a “top-down” approach. It starts with a centralized, normalized, enterprise-wide data warehouse as the single source of truth, with department-specific data marts derived from that central repository afterward.
- Pros: This “hub-and-spoke” model keeps data integrity and consistency high across the enterprise and reduces redundancy.
- Cons: Requires significant upfront planning and data modeling, which makes the initial build slower and more resource-intensive than the Kimball approach.
In practice, many implementations are hybrids: a normalized, Inmon-style central data store for enterprise-wide governance, exposing data to business users through Kimball-style star schema data marts for performance and ease of use.
Lakehouse or data mesh: which cloud pattern fits?
Two dominant patterns have emerged to handle data volume and variety in the cloud.
The Lakehouse architecture merges the low-cost, flexible storage of a data lake with the performance and transactional reliability of a data warehouse. Instead of maintaining separate systems, a Lakehouse runs BI and analytics directly on data stored in open formats (Apache Iceberg, Delta Lake) inside the data lake. It fits organizations that want to unify their data platform and support both traditional BI and AI/ML workloads on the same data, cutting duplication and architectural complexity. See our guide on what a Lakehouse architecture is for more detail.
The Data Mesh is an organizational and technical model for decentralizing data ownership, meant to remove the bottleneck of a single central data team. It treats data as a product and applies domain-driven design to analytics.
- Decentralized Ownership: Business domains (marketing, finance, and so on) own their data end-to-end.
- Data as a Product: Each domain delivers reliable data products that other domains can consume.
- Self-Serve Infrastructure: A central platform team builds the tools and infrastructure that let domain teams manage their own data products.
- Federated Governance: A shared set of standards keeps data products interoperable, secure, and compliant.
This fits large, complex organizations where a centralized model gets in the way of speed. It puts data ownership in the hands of the teams that actually understand the domain.
Cloud or on-premise: how do you decide?
The deployment model for a data warehouse - cloud or on-premise - is a fundamental architectural choice with real consequences for cost, scalability, and operations.
The industry trend runs strongly toward cloud, but on-premise deployments remain common in organizations with strict security or regulatory constraints, especially where data residency rules limit where data can physically sit. The shift toward cloud has also driven the rise of ELT, since cloud platforms have the compute power to run transformations in-database. For more, see these data warehouse best practices from Estuary.
Weighing the two requires an honest look at the practical trade-offs.
How do the cost models compare?
The financial models work in opposite directions.
An on-premise deployment is a Capital Expenditure (CapEx). It requires a large upfront investment in servers, storage, networking hardware, and data center space. That gives a predictable, fixed cost, but it also creates a high barrier to entry and locks the organization into hardware with a limited useful life.
Cloud data warehouses run on an Operational Expenditure (OpEx) model. Organizations pay a recurring bill based on what they actually use (storage and compute). That removes the need for a large capital outlay, which is why advanced analytics is now accessible to companies that couldn’t have justified the on-premise capital project.
How does scalability compare between the two?
This is where the two models diverge most.
On-premise systems have fixed capacity. Scaling to meet peak demand - end-of-quarter reporting, for example - means a slow, expensive hardware procurement cycle. That forces organizations to provision for the worst case, which leaves resources sitting idle most of the time.
Cloud platforms offer elastic scalability. Compute can be provisioned on demand for intensive workloads and de-provisioned once the job is done, made possible by the architectural separation of storage and compute. Organizations pay only for what they actually consume, when they consume it.
A practical benefit is workload isolation. A finance team can run resource-intensive month-end reports without slowing down real-time marketing dashboards, since each workload can get its own dedicated compute cluster.
Who’s responsible for security in each model?
The security model shifts from full control to a shared, specialized partnership.
With an on-premise warehouse, the organization owns total responsibility for security - physical data center access, network firewalls, user access controls, all of it. That level of control is often a requirement in regulated sectors like government, healthcare, and finance.
Cloud providers run on a shared responsibility model. The provider (AWS, Google Cloud, Microsoft Azure) secures the underlying infrastructure. The customer secures their data within the cloud through access controls, encryption, and identity management. That means ceding some control, but major cloud providers bring security expertise and tooling that most individual organizations can’t match on their own.
Who handles maintenance in each model?
This determines who owns operational uptime.
An on-premise warehouse needs a dedicated in-house team for hardware management, software patching, backups, and incident response. That builds internal expertise, but it also carries real operational overhead and depends on the availability of specialized talent.
Cloud data warehouses are managed services. The provider handles the underlying infrastructure maintenance - provisioning, patching, system updates. That frees data engineers to spend their time on data modeling, query optimization, and the work that actually delivers business insight.
How do you select a data engineering partner?
Picking the right technology is only part of a successful data warehouse implementation. The expertise of the team designing and building it matters just as much. Choosing a partner takes a rigorous look at their technical competence, architectural thinking, and track record.
A good partner combines deep technical knowledge with a practical sense of how to build data platforms that actually hold up. The wrong choice produces a brittle system that’s hard to maintain and doesn’t deliver on the business objectives it was built for.
Why don’t certifications alone tell you enough?
Certifications on platforms like Snowflake, Databricks, or BigQuery are a baseline signal of theoretical knowledge, but they don’t substitute for hands-on experience.
Instead of asking “Are your engineers certified?” ask “Walk me through a project where you migrated a legacy on-premise warehouse to a cloud-native Lakehouse architecture.” That reframes the conversation around demonstrated capability instead of credentials. A partner with real experience has worked through the messy, real-world complications that come with a project like that.
An experienced partner understands platform-specific performance tuning, cost optimization, and the common implementation pitfalls that only show up through practice. That’s what prevents cost overruns and technical debt down the line.
Ask for case studies and references from projects comparable to yours in scale, complexity, and industry.
How do you evaluate a partner’s architectural philosophy?
A strong partner acts as a strategic advisor, not an order-taker. During evaluation, present your proposed architecture and ask them to critique it - their response tells you a lot about their depth and their problem-solving approach.
Do they ask probing questions about your business objectives? Do they propose alternatives and explain the trade-offs? A partner who just accepts your initial design without pushback may not have the strategic depth to build something durable.
You want a team that thinks architecturally - one that can explain the reasoning behind different data modeling techniques, justify its technology choices, and design for growth rather than just for the current spec.
Why does industry-specific expertise matter?
Every industry has its own data challenges: regulatory compliance in finance (SOX) and healthcare (HIPAA), supply chain complexity in manufacturing. A partner with experience in your vertical is a real advantage - they already know your domain’s data sources, KPIs, and the rules that apply to it.
That industry knowledge speeds up the project and lowers risk:
- Faster Onboarding: They already understand your terminology and KPIs.
- Reduced Risk: They can design proactively for GDPR, HIPAA, or CCPA compliance requirements.
- Higher Value: They may flag industry-specific analytics or use cases you hadn’t considered.
Ask for client references and case studies from your industry to check their domain expertise is real.
How do you compare vendors objectively?
To keep the evaluation structured, use a vendor scorecard to compare potential partners against a consistent set of criteria. It gives you a documented, systematic way to score candidates and spot risks before you commit.
The table below is a template for that scorecard: key criteria, questions to ask, and red flags to watch for.
Vendor Evaluation Scorecard for Data Engineering Partners
This scorecard helps you systematically assess data engineering firms for a fair, thorough comparison.
| Evaluation Criterion | Key Questions to Ask | Red Flags to Watch For |
|---|---|---|
| Technical Expertise | Can you walk us through a similar Lakehouse migration project? What were the key challenges and how did you solve them? | Vague answers, heavy reliance on buzzwords, or an inability to discuss the technical trade-offs in detail. |
| Industry Experience | What is your experience with data compliance in our industry (HIPAA, GDPR)? Can you share specific examples? | Generic project stories that don’t connect to your industry’s specific data challenges or regulations. |
| Project Methodology | How do you manage project scope, budget, and timelines? What’s your process for keeping stakeholders in the loop? | No clear, documented methodology; rigid processes that can’t adapt when things change. |
| Team Composition | Who are the actual people who will be on our project? Can we review their experience and talk to them? | The bait-and-switch pattern: senior experts charm you in sales calls, then junior staff do the actual work. |
Working through these criteria methodically gets you a data-driven decision and a partner equipped to deliver on your architecture, not just talk about it.
Common questions about data warehouse architecture
What’s the difference between a data warehouse and a data lake?
A data warehouse works like a library. It stores structured, processed, verified data (books) organized for a specific purpose: efficient querying and analysis. The data is clean, reliable, and ready to use.
A data lake works like a reservoir. It collects raw data in its native format from many sources, storing structured, semi-structured, and unstructured data (JSON files, images, logs) cheaply. That raw data has to be processed and refined before it’s usable for most analytical purposes. Our guide on data warehouse vs. data lake covers this decision in more depth.
The Lakehouse architecture aims to unify these two. It combines the low-cost, flexible storage of a data lake with the performance, reliability, and governance of a data warehouse, enabling direct analytical querying on raw data.
This hybrid model is becoming the default for modern cloud data platforms because it supports a wide range of workloads - from standard BI to machine learning - inside a single, unified architecture.
When should you choose ELT over ETL?
The choice between ETL and ELT mostly comes down to the computational power of the target system.
ELT (Extract, Load, Transform) is the standard approach for modern, massively parallel processing (MPP) cloud data warehouses like Snowflake, Google BigQuery, or Amazon Redshift. These platforms have enough compute power to run complex transformations in-database more efficiently than a separate transformation engine could.
- Key Advantage: Flexibility. Raw data loads quickly, and transformations can be built and changed later without re-ingesting the source data - useful as business requirements shift.
ETL (Extract, Transform, Load) still matters in specific scenarios: when the target database doesn’t have the power to transform data efficiently, or for compliance use cases where sensitive data has to be anonymized or masked before it lands in the central repository.
How do you build a warehouse that still works when AI and ML workloads show up?
Preparing for future AI and machine learning workloads is less about picking specific tools and more about getting the foundations right. High-quality, accessible data is the prerequisite for any AI initiative that’s going to work.
Three architectural concepts matter most:
- Separate Storage and Compute: Decoupling these resources lets you provision large compute clusters for model training elastically, without disrupting concurrent BI workloads - scaling up for training and back down once it’s done, to keep costs in check.
- Embrace a Lakehouse Pattern: Data scientists need access to both raw, exploratory data and clean, feature-engineered data. A Lakehouse architecture gives them a single environment covering the full range of data needed for model development.
- Prioritize Data Governance and Cataloging: An AI model is only as good as its training data. Solid data governance, automated data quality checks, and a real data catalog are what make an AI system trustworthy rather than a black box.
Get these three right and the same foundation supports both current analytical needs and whatever AI workload shows up next.
Putting the architecture decision into practice
The layers, the Kimball/Inmon choice, the cloud-versus-on-premise trade-offs - these decisions compound. A staging layer built without clear ownership creates rework once the storage layer is designed; a schema chosen for query speed today can turn into a maintenance burden once five more data marts get built on top of it. Get the early layers right and the rest of the architecture gets easier to build, not harder.
If you’re weighing lake versus warehouse from scratch, start with data warehouse vs. data lake; if you’re further along and choosing between a fresh build and an existing platform, what is a data platform covers that distinction. And whichever architecture you land on, the vendor scorecard above works just as well against the firms in the Index as it does in a live vendor call - ask each one to critique your proposed design before you sign anything.
- Part of our guide: Data Pipeline Architecture →
- Part of our guide: Snowflake Consulting →

Researched & written by
Peter Korpak , Chief Analyst & Founder
Data-driven market researcher with 20+ years in market research and 10+ years helping software agencies and IT organizations make evidence-based decisions. Former market research analyst at Aviva Investors and Credit Suisse.
Previously: Aviva Investors · Credit Suisse · Brainhub · 100Signals
- phDataNot verified
Consider phData for Snowflake data engineering, migrations, and SAP-to-Snowflake analytics. Snowflake confirms its Elite tier; check references for your source systems and agree on the work before hiring.
Reviewed - STX Next500+ specialists · unverified
European nearshore data engineering for fintech, manufacturing, or logistics. Ask for relevant project references and verify any required AWS or Snowflake credentials.
Listed, not reviewed - Aimpoint DigitalNot verified
Consider Aimpoint for programs using Snowflake, Databricks, and dbt. It lists credentials for all three; ask for relevant references and the names of the proposed consultants.
Reviewed
More in Data Pipeline Architecture
Snowflake Schema and Star Schema: A Practical Guide for Modern Data Warehouses
Snowflake schema vs star schema explained: compare query performance, storage trade-offs, and real-world use cases to choose the right model for your data warehouse.
A Practical Guide to Snowflake Cost Optimization
Discover proven Snowflake cost optimization strategies. This guide covers compute, storage, and governance to help you reduce your Snowflake bill.
How to Build Data Pipelines That Last
Learn how to build data pipelines that are reliable, AI-ready, and efficient. A practical guide to modern data engineering strategies.