A Practical Guide to Data Modeling Techniques for Modern Data Platforms
Data modeling techniques are the blueprints for organizing information inside a data platform. The three that matter for most engineering teams are the relational model, the dimensional model, and Data Vault, and each is built for a different job: relational for transactional integrity, dimensional for fast analytical queries, Data Vault for auditable, source-agnostic integration. Picking the wrong one for the job doesn’t show up as a modeling error, it shows up months later as slow dashboards and an inflated cloud compute bill.
This guide walks through how each model works, how the choice plays out specifically on Snowflake and Databricks, and how to apply all three to the same e-commerce scenario so the trade-offs are concrete rather than theoretical.
Why does choosing the right data model matter more once you’re on the cloud?
Data modeling is the architectural design phase for your data infrastructure, and the technique you pick has to match the intended business outcome. Get the match wrong and you end up with slow queries, inflated cloud compute costs, and a data platform that produces reports nobody trusts.
This guide is a practical walkthrough for data engineers and technical leaders: how each model affects analytics performance, scalability, and cost, particularly on cloud platforms like Snowflake and Databricks. The model you choose is the foundation everything else in the platform gets built on.
Why data modeling still matters when storage is cheap
Cheap cloud storage and powerful compute make it tempting to load raw data into a lake and defer structure until later. That approach usually produces a “data swamp” - an unreliable, disorganized repository that isn’t usable for serious analytics. Data modeling is what keeps that from happening.
A well-designed data model delivers tangible benefits:
- Clarity and Consistency: It establishes a single source of truth by enforcing business rules and defining data relationships in an unambiguous, structured manner.
- Performance Optimization: By organizing data around its query patterns, a proper model reduces query latency and, with it, compute cost.
- Scalability: It provides a framework that can absorb new data sources and changing business requirements without a full architectural overhaul.
- Effective Governance: It simplifies lineage tracking, quality checks, and compliance reporting by giving you a clear, logical map of the data.
Where today’s modeling techniques came from
The relational model, formalized by Edgar F. Codd in 1970, introduced the tables-and-keys structure that still runs the majority of transactional systems today. It became the industry standard by the late 1980s, replacing the hierarchical databases that came before it, and its core ideas have outlasted several generations of hardware since.
New techniques developed since then were built for analytics at scale, not to replace that foundation. Architectures like the lakehouse don’t substitute for data modeling. They’re a new environment where the same modeling principles get applied. For more on how a lakehouse compares to a traditional warehouse, see our guide on data warehouses vs. data lakes.
What are the three core data modeling techniques, and when should you use each one?
Data modeling means choosing a philosophy for how information gets organized. The three techniques below aren’t rigid rulebooks. They’re strategic frameworks, and understanding the “why” behind each one is what lets you match the right technique to the right business problem.
1. The Relational Model: Optimized for Data Integrity
The relational model, typically implemented in its Third Normal Form (3NF), is the most established approach. Its core philosophy is the elimination of data redundancy to ensure data integrity. It deconstructs data into its smallest logical components, storing each in a separate, normalized table.
For example, a single customer order is atomized into tables for customers, orders, order line items, and products. This structure is the gold standard for data integrity. If a customer’s address changes, the update occurs in a single location, and the change is instantly propagated through relationships.
This focus on write-efficiency and consistency makes the relational model the standard for Online Transaction Processing (OLTP) systems. These are the databases that power daily business operations like e-commerce transactions, banking, and inventory management.
2. The Dimensional Model: Optimized for Analytical Queries
While the relational model excels at writing and updating data, its highly normalized structure is inefficient for analytics. Answering a simple business question can require joining numerous tables, resulting in slow and complex queries. The dimensional model, developed by Ralph Kimball, was engineered to solve this problem.
Its philosophy is to organize data for intuitive browsing and fast query performance. The model centers on a fact table (containing quantitative metrics like sales totals) surrounded by descriptive dimension tables (providing context like time, location, and product). This structure is known as the star schema.
Data is intentionally “denormalized,” reintroducing some redundancy to simplify the structure. A sales fact table holds key metrics (revenue, quantity) and is linked directly to dimension tables for date, customer, and product. This design enables BI tools to efficiently slice and dice data, answering questions like, “What were total sales by product category in the Northeast last quarter?” with minimal latency.
By prioritizing query performance and business usability over storage efficiency, dimensional modeling became the foundation of modern analytics. It is designed for read-heavy reporting workloads where speed and simplicity matter most.
3. The Data Vault Model: Optimized for Scalability and Auditability
Modern data ecosystems are characterized by a high volume of disparate data sources and evolving business rules. Both relational and dimensional models can be brittle in this environment; integrating a new source often requires significant re-engineering. The Data Vault model was designed specifically to handle this complexity with agility and full auditability.
Its philosophy is to ingest raw data from source systems with complete traceability and historical context, without applying business logic upfront. It organizes data into three core components:
- Hubs: Store unique business keys (e.g., Customer ID, Product SKU). They represent the core business entities.
- Links: Define the relationships or transactions between Hubs (e.g., a link connecting a specific customer to a purchased product).
- Satellites: Contain the descriptive, time-stamped attributes associated with Hubs or Links (e.g., a customer’s address or a product’s price), capturing all historical changes.
This structure is highly resilient. Integrating a new data source involves adding new Hubs, Links, and Satellites without altering the existing model. This makes Data Vault an excellent choice for the raw integration layer of a data warehouse, providing a fully auditable, scalable foundation from which curated, business-focused data marts can be built.
Comparing Data Modeling Techniques at a Glance
This table breaks down the primary goals and trade-offs of the three core philosophies to help guide selection.
| Technique | Primary Goal | Best For | Key Weakness |
|---|---|---|---|
| Relational (3NF) | Eliminate Redundancy & Maximize Integrity | Transactional Systems (OLTP) | Complex and slow for analytical queries. |
| Dimensional | Optimize for BI & Fast Query Performance | Data Warehouses & Analytics (OLAP) | Can be less flexible for integrating new sources. |
| Data Vault | Maximize Scalability & Auditability | Raw Data Integration Layers | Overly complex for direct BI querying. |
The optimal model is context-dependent. The choice must align with the specific objective, whether it’s processing transactions with high fidelity, enabling rapid business insight, or building a foundation for enterprise data that can absorb whatever comes next.
How does your modeling choice drive cloud platform costs?
In on-premise data warehouses, a suboptimal data model showed up as slow reports. In the cloud it shows up as a bill: every inefficient query burns compute credits, and your data modeling technique is one of the biggest levers you have over that spend.
Consumption-based pricing models from platforms like Snowflake and Databricks have shifted the economic calculus. Compute is now the primary cost driver, not storage. This reality requires a re-evaluation of data modeling efficiency. A model considered efficient a decade ago can be a financial liability in the cloud.
Snowflake and the Power of Denormalization
Snowflake’s architecture is optimized for high-speed analytical queries and rewards models that align with its strengths. Running an analytical query on a highly normalized Third Normal Form (3NF) model requires the query engine to perform multiple complex joins, piecing together data from numerous tables.
Each join consumes processing power, spinning up virtual warehouses and accruing compute credits. While 3NF is ideal for eliminating redundancy in OLTP systems, it is an inefficient and costly approach for analytics in a consumption-based cloud data warehouse.
This is where a denormalized dimensional model, such as a star schema, becomes a cost-optimization tool.
By pre-joining and denormalizing data into wide fact and dimension tables, you dramatically reduce the complexity of analytical queries. Instead of multi-table joins, analysts execute simple, direct queries that Snowflake’s engine processes with high efficiency, minimizing warehouse usage and controlling costs.
Aligning the data model with the platform’s architecture is a critical cost management strategy. In Snowflake, implementing a star schema is not just a performance tactic; it is an economic decision.
Databricks, The Lakehouse, and Medallion Architecture
The Databricks lakehouse environment prioritizes flexibility and scalability, particularly for managing diverse and evolving data sources. The Data Vault modeling technique is highly effective in this context, especially when paired with the Medallion Architecture.
The Medallion Architecture (Bronze, Silver, Gold) is a data quality and lifecycle management framework, not a data modeling technique itself. It provides a logical progression for refining data, and different modeling techniques are applied at each layer.
- Bronze Layer: Raw, unaltered data lands here. Minimal to no modeling is applied.
- Silver Layer: Data is cleansed, conformed, and integrated. This layer is the ideal home for a Data Vault model. Its structure accommodates schema changes from source systems and provides a fully auditable historical record without prematurely applying business rules.
- Gold Layer: Data is aggregated and optimized for specific business use cases. This layer is almost always built using dimensional models (star schemas) to serve high-performance, user-friendly datasets for BI and analytics.
This hybrid approach draws on the strengths of multiple techniques. The Data Vault in the Silver layer provides a scalable and governed foundation. From this stable core, multiple purpose-built, cost-effective star schemas can be provisioned in the Gold layer, ensuring analytics are both fast and based on trusted, auditable data.
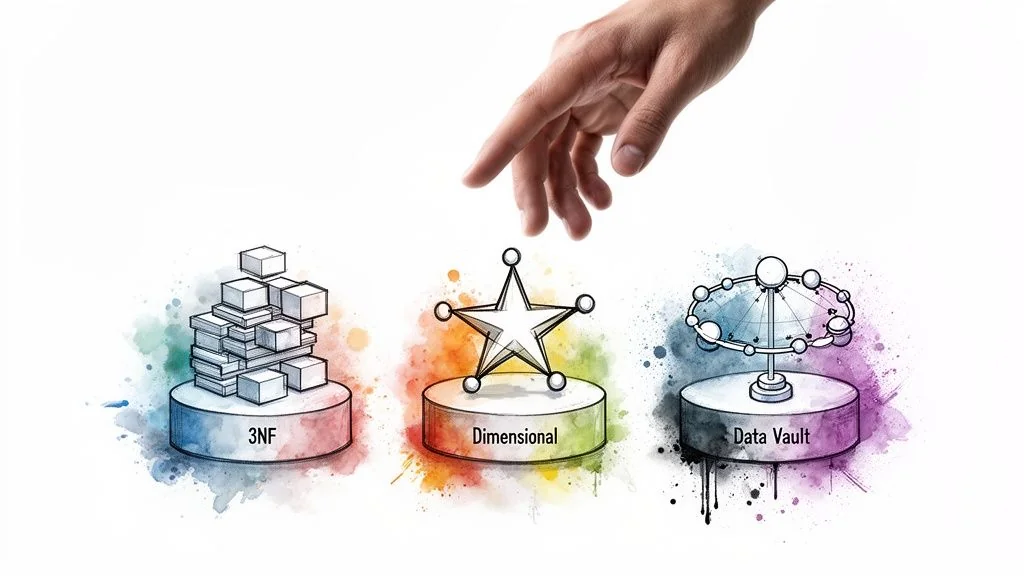
The infographic below illustrates the core philosophies behind these different modeling approaches.
This visual comparison clarifies how Relational, Dimensional, and Data Vault models are each optimized for different objectives - integrity, analytics, or auditability - which in turn dictates their cost and performance on cloud platforms.
How do the three models answer the same business question differently?
Modeling the same e-commerce order data three ways, as a normalized 3NF schema, a dimensional star schema, and a Data Vault, reveals what each technique actually optimizes for. Asking all three the same question, “what were total sales by category last quarter,” shows exactly where the complexity moves.
Example 1: The 3NF Relational Model
The relational model in Third Normal Form (3NF) prioritizes the elimination of data redundancy, making it ideal for operational databases that must process transactions with high efficiency and integrity.
For our e-commerce scenario, a single customer order is atomized into multiple specialized tables. Each piece of information is stored once.
Customers: Contains only customer data (CustomerID, Name, Address).Products: Contains only product information (ProductID, ProductName, Category).Orders: Records core transaction details (OrderID, CustomerID, OrderDate).Order_Items: Links orders to products and stores line-item details (OrderItemID, OrderID, ProductID, Quantity, Price).
Answering the Question:
To calculate total sales by category, an analyst must write a query that joins Orders to Order_Items and then joins that result to Products. While this ensures data consistency, the join complexity makes it computationally expensive and slow for recurring analytical workloads.
Example 2: The Dimensional Star Schema
The dimensional model reshapes the same data for analytical performance. The goal is to create an intuitive structure for fast querying, resulting in a star schema.
The model is built around a central fact table (numeric measures) linked directly to descriptive dimension tables (context).
fct_orders(Fact Table): Contains the core numeric measures likequantity_soldandtotal_sales_amount, along with foreign keys (customer_key,product_key,date_key) that reference the dimension tables.dim_customer(Dimension Table): Contains all descriptive customer attributes (name, location, segment).dim_product(Dimension Table): Contains all product attributes, includingname,brand, andcategory.dim_date(Dimension Table): A dedicated table for time-based analysis, with columns for day, month, quarter, and year.
The power of the star schema lies in its simplicity. We intentionally denormalize some data (e.g., storing the product category directly in
dim_product) to eliminate the complex joins required by the 3NF model.
Answering the Question:
An analyst writes a simple query joining the fct_orders table directly to dim_product and dim_date. They can filter by quarter in the date dimension and group by category in the product dimension. This clean, direct query path is what enables the rapid response times expected from modern BI tools.
Example 3: The Data Vault Model
A Data Vault model prioritizes auditability, scalability, and the non-destructive integration of data from multiple source systems.
It deconstructs the business process into its fundamental components: Hubs, Links, and Satellites.
hub_customer&hub_product(Hubs): Store only the unique business keys for core entities (CustomerID,ProductID). They are the “nouns” of the business.link_order(Link): Documents the relationship (transaction) between Hubs. It holds the keys forhub_customerandhub_product, plus the order identifier. It represents the “verb.”sat_customer_details&sat_product_details(Satellites): Contain the descriptive, time-stamped attributes for each hub. For example,sat_customer_detailsstores the customer’s name and address with load dates, providing a complete historical record of all changes.
Answering the Question: Generating the sales report from a raw Data Vault requires joining Hubs, Links, and Satellites to reconstruct the business context. Due to this complexity, a Data Vault is rarely queried directly by end-users for BI. Instead, it serves as a durable, auditable foundation, a single source of truth, from which user-friendly dimensional models (star schemas) are built for the final analytics layer.
What changes once a data model moves from whiteboard to production?
A data model isn’t a diagram, it’s the operational core of your data platform: its structure dictates your ETL/ELT pipeline logic, your modern data stack tooling choices, and how much governance work happens automatically versus manually.
Implementing a data model in a production environment is where theory meets the complexities of real-world data operations. Its design also sets the foundation for how you handle data contracts between teams that produce and consume the same data.
How Your Model Shapes Your Pipelines
The structure of your data model defines the logic for your ETL (Extract, Transform, Load) or ELT (Extract, Load, Transform) pipelines. The two are intrinsically linked. A mismatch creates brittle, inefficient processes that are difficult to maintain.
Different models require different pipeline logic:
- Dimensional Models: Building a star schema requires transformation-heavy pipelines. They must join data from multiple sources, calculate derived metrics, and manage slowly changing dimensions before loading the final, curated data into fact and dimension tables.
- Data Vault Models: In contrast, loading a Data Vault is typically a simpler, more direct process. Pipelines are designed to insert raw, unaltered data into Hubs, Links, and Satellites with minimal transformation. The complex business logic is applied downstream when building the consumption layer.
The decision is not about which approach is “easier” but about where to manage complexity. A dimensional model front-loads the transformation work to optimize query performance. A Data Vault simplifies the initial ingestion to maximize auditability and flexibility, deferring complex transformations to the final stage.
Building Governance Directly Into Your Model
An effective data governance strategy is impossible without a well-designed data model. The model provides the structural map needed to manage data quality, track lineage, and enforce compliance.
The choice of data modeling technique directly impacts governance capabilities. A Data Vault, for example, is inherently designed for auditability. Its structure captures historical changes and source system metadata by default, making data lineage a built-in feature rather than an add-on.
A dimensional model, conversely, acts as a governance checkpoint. By enforcing business rules and consistency during the loading process, it ensures that data exposed to analysts is already cleansed and conformed, providing a trusted single source of truth for reporting.
Taming Schema Evolution and Setting Standards
Business requirements and source systems change. New fields are added, old ones are deprecated, and definitions evolve. How a data model handles this schema evolution determines its long-term viability.
Discipline around standards and tooling is non-negotiable.
- Enforce Naming Conventions: A consistent schema for naming tables and columns (e.g., using prefixes like
fct_,dim_,stg_) makes the data warehouse immediately comprehensible and maintainable. - Mandate Documentation: Every table, column, and transformation requires a clear, accessible description. This is essential for long-term maintenance and onboarding new team members.
- Adopt dbt-Style Tooling: Tools like dbt, used by 20 of the 86 firms profiled in the Data Engineering Companies Index, have become central to modern data engineering because they let teams define standards, automate data quality tests, and version-control transformation logic, turning governance policy into executable code.
By putting a disciplined process in place for managing change, you build a data model that can adapt without fracturing. This also positions you to properly evaluate engineering partners on their ability to build systems that hold up as requirements change.
Which Data Modeling Approach Should You Actually Use?
There’s no single best data modeling technique. The right one depends on whether you’re optimizing for transaction integrity, analytics speed, or auditability, and most cloud platforms end up using more than one at different layers. Here are direct answers to the questions data leaders and their teams ask most.
Which Data Model Is Best for AI and Machine Learning?
There is no single “best” model; the right choice depends on the specific AI/ML application.
For feature engineering, a denormalized, wide-table format is typically most effective. This involves creating a single, feature-rich table that aggregates all the variables a model might need. Such tables are often derived from a dimensional model (the Gold layer in a Medallion Architecture), providing ML algorithms with a flat, easy-to-consume dataset.
However, for applications requiring high auditability, such as fraud detection systems that must trace transactions to their source, a Data Vault model is invaluable. Residing in the Silver layer, it provides the untransformed, historical data needed to source trustworthy features.
The final feature store consumed by an ML model will almost always be a denormalized view. The underlying Dimensional or Data Vault models provide the governed, structured foundation to create those features reliably and repeatably.
Can We Mix and Match Different Data Models?
Yes, and it is a modern best practice to do so. A hybrid approach that combines multiple data modeling techniques within the same data platform typically provides the most flexible and powerful solution.
A highly effective pattern is to use a Data Vault in the integration layer (the “Silver” layer). It is designed to ingest raw data from diverse sources and maintain a perfect, auditable record. From this central vault, multiple data marts using dimensional models (star schemas) can be provisioned for different business domains.
This strategy combines the scalability and audit trail of a Data Vault with the query performance and business-friendliness of dimensional models, delivering the best of both worlds.
How Does the Medallion Architecture Fit into All This?
The Medallion Architecture (Bronze, Silver, Gold) is not a data modeling technique itself. It is a data quality and lifecycle framework that organizes the flow of data from raw to refined. Think of it as the factory layout, while data modeling techniques are the machinery within it.
They work together as follows:
- Bronze Layer: Raw data ingestion. Minimal or no formal modeling is applied.
- Silver Layer: Data is cleansed, validated, and integrated. This is the ideal layer to implement a normalized (3NF) or Data Vault model to create a single source of truth.
- Gold Layer: The presentation layer for analytics and BI. It is almost always built using dimensional models like star schemas, since they’re what typically feeds a semantic layer and serves end-user queries.
Is the Inmon vs. Kimball Debate Still Relevant?
The core principles are still relevant, but their implementation must be adapted for the cloud. The classic Inmon approach - a highly normalized, enterprise-wide data warehouse feeding smaller, dependent data marts - was designed for on-premise systems where storage was the primary cost constraint.
Cloud economics are inverted. On platforms like Snowflake or Databricks, storage is inexpensive, while compute is the primary cost driver. Executing complex joins across a massive 3NF warehouse is financially inefficient.
The modern interpretation retains Inmon’s principle of a governed, central source of truth but updates the implementation. Instead of a strict 3NF core, many architects now use a Data Vault or Ralph Kimball’s bus architecture as the central hub, which then feeds the dimensional models. This provides the integrated core Inmon advocated for, but in a structure that is optimized for the cloud’s cost model.
Choosing the Model That Fits Your Platform
The right technique depends on the job, not on which one is trendiest. Relational for transactional integrity, dimensional for fast BI queries, Data Vault for auditable integration of many source systems, and on most cloud platforms today, some combination of the three doing different jobs at different layers. If you’re evaluating a firm to help implement one of these, the Data Engineering Companies Index profiles engineering firms by the platforms and modeling approaches they actually work with, not just by what they claim to do.
Researched & written by
Data-driven market researcher with 20+ years in market research and 10+ years helping software agencies and IT organizations make evidence-based decisions. Former market research analyst at Aviva Investors and Credit Suisse.
Previously: Aviva Investors · Credit Suisse · Brainhub · 100Signals
Vetted partners
Top Data Pipeline Partners
Vetted firms whose specialty matches this article.
More in Data Pipeline Architecture
Data Contracts in Data Engineering: A Guide for Engineering Leaders
Explore data contracts in data engineering to enforce agreements, prevent pipeline failures, and boost data reliability across Snowflake and Databricks.
Snowflake Schema and Star Schema: A Practical Guide for Modern Data Warehouses
Snowflake schema vs star schema explained: compare query performance, storage trade-offs, and real-world use cases to choose the right model for your data warehouse.
Top Data Engineering Managed Services for 2026
Compare leading data engineering managed services. Find models, pricing, & vendors. Use our RFP checklist to select your ideal Snowflake or Databricks partner.