Analytics in Manufacturing: A Practical Guide to Turning Data into ROI
Manufacturing analytics is no longer a forward-looking concept; it is the operational standard for competitive production. It is the practice of converting raw data from machinery, supply chains, and business systems into actionable intelligence that drives smarter, faster, and more profitable decisions. Think of it as installing a central nervous system in your operation—one that senses problems, spots opportunities, and reacts in real-time.
This is not about chasing technology for technology’s sake. It’s about taking the vast streams of data your operation already generates and using them to solve concrete business problems.

Why Data Is Your Most Valuable Raw Material
In manufacturing, inputs like steel, plastic, or chemicals are understood as critical raw materials. Today, a more valuable resource is data. The problem is, it’s often locked away in siloed systems, completely untapped.
Every sensor reading, every production log, and every supply chain update is a piece of a much larger puzzle. Without a unified way to connect these dots, manufacturers operate with significant blind spots.
This shift isn’t a response to trends but to the relentless pressures every manufacturer faces: rising operational costs, unpredictable supply chains, and fierce global competition have eliminated the margin for error. Relying on historical trends and gut instinct alone has become a substantial business risk.
The Big Shift: From Reactive to Proactive Operations
Manufacturing has traditionally operated in a reactive mode. A machine breaks, then you fix it. A quality issue is found, then you scrap the batch. A supplier is late, and you scramble to adjust the production schedule.
Analytics fundamentally inverts this model, enabling proactive decision-making.
By treating data as a strategic asset, manufacturers can move from a state of constant fire-fighting to one of controlled, predictable optimization. This shift is fundamental to building a resilient and competitive operation.
This potential is fueling significant investment. The manufacturing analytics market is projected to grow from $13.97 billion in 2024 to $16.79 billion in 2025, reaching an estimated $40.9 billion by 2029. This growth is driven by a clear need for efficiency, with real-time analytics helping companies cut supply chain delays by up to 20-30%.
A solid analytics strategy enables you to:
- Anticipate Failures: Predict when equipment needs maintenance before it causes a costly, unplanned shutdown.
- Optimize Quality: Pinpoint the root causes of defects as they happen, dramatically reducing scrap and rework.
- Improve Yield: Make precise, data-informed adjustments to processes to get more finished product from the same inputs.
- Increase Visibility: Track materials and components across the entire supply chain, turning potential disruptions into manageable events.
This guide provides a practical roadmap to making these outcomes a reality, from core concepts to implementation.
Core Principles of Manufacturing Analytics
The following table breaks down the foundational ideas for implementing a successful analytics program. It’s about a fundamental shift in how operational information is viewed and used.
| Principle | Description | Business Impact |
|---|---|---|
| Data as an Asset | Treating operational data not as a byproduct, but as a core strategic resource that holds untapped value. | Enables data-driven decisions, uncovers hidden inefficiencies, and creates new revenue opportunities. |
| Single Source of Truth | Consolidating data from disparate systems (OT/IT) into a unified platform to eliminate silos. | Provides a holistic view of operations, ensures consistency, and builds trust in the data. |
| From Reactive to Proactive | Using predictive models to anticipate future events (e.g., equipment failure, quality issues). | Reduces unplanned downtime, minimizes waste, and improves resource planning and scheduling. |
| Democratization of Insights | Making data and analytics tools accessible to personnel from the shop floor to the top floor. | Empowers frontline workers to solve problems and fosters a culture of continuous improvement. |
Adopting these principles is the first step toward building a data-centric culture that drives measurable results across the entire operation.
Four Use Cases That Actually Drive ROI
The value of analytics is not in hoarding data, but in applying it to solve specific, high-cost problems. Let’s examine four areas where manufacturing analytics consistently delivers a measurable return on investment. These are direct routes to cutting costs, boosting efficiency, and building a more resilient operation.
Predictive Maintenance Prevents Downtime
Unplanned downtime is a direct drain on profitability. Historically, maintenance options were either reactive (fix-it-when-it-breaks) or preventive (service on a rigid schedule), both of which are inherently wasteful.
Predictive maintenance offers a more intelligent approach. By fitting machines with sensors that track operational parameters like vibration, temperature, and power consumption, a constant stream of health data is generated.
Machine learning models analyze this data to learn the unique operational signature of each asset. When the analytics detect subtle deviations that signal an impending failure, it automatically alerts the maintenance team, often weeks in advance.
This foresight transforms maintenance operations:
- Slash Downtime: Repairs can be scheduled during planned shutdowns, avoiding abrupt halts to production.
- Focus Resources: Technicians work on equipment that requires attention, not just what’s next on a calendar.
- Cut MRO Costs: Parts are replaced based on actual wear, extending component life and reducing the need for extensive spare parts inventory.
A McKinsey study found that companies using predictive maintenance see 30–50% less machine downtime and a 10–30% jump in throughput. This is a direct conversion of data into uptime and profit.
AI-Powered Quality Control
Traditional quality control methods, like manual inspection and statistical process control (SPC), are often too slow to prevent defects in modern high-speed production environments. They can miss subtle flaws that lead to scrap, rework, or recalls.
Modern analytics brings a higher level of precision. High-resolution cameras and sensors capture detailed data at every production step. AI-powered computer vision models analyze this information in real-time, identifying defects a human eye could never detect.
This creates an immediate feedback loop. Instead of discovering a bad batch at the end of a shift, the root cause of a quality issue can be pinpointed the moment it occurs. This allows operators to adjust process variables—like temperature, pressure, or material mix—before significant waste is produced. In regulated industries like pharmaceuticals, this real-time quality assurance is essential for risk management and compliance.
Yield Optimization: Squeezing More from Less
In process manufacturing—such as chemicals, food, or semiconductors—even a fractional improvement in yield can translate to millions of dollars in value. Yield optimization uses data to fine-tune production recipes to maximize finished product from a given amount of raw material.
A machine learning model can analyze thousands of variables simultaneously—sensor readings, ambient conditions, raw material characteristics—to identify the exact combination of settings that produces the highest output. This “golden batch” profile becomes the operational target.
The system then monitors production in real-time, providing operators with small, data-backed recommendations to maintain peak process performance. These incremental adjustments compound to create a significant impact on profitability without capital expenditure on new equipment.
Enhanced Supply Chain Visibility
Recent global disruptions have exposed the fragility of supply chains that rely on static spreadsheets and infrequent updates. A post-2020 analysis showed a 40% increase in the adoption of inventory analytics as a direct response to this volatility.
Modern analytics platforms provide a dynamic, real-time map of the entire supply chain. By integrating data from suppliers, logistics partners, and internal ERP systems, manufacturers can track materials from origin to factory floor. This level of visibility transforms chaos into predictability.
Advanced models can also provide predictive insights. By analyzing external data—such as weather patterns, port congestion, and geopolitical events—they can flag potential disruptions before they impact operations. This gives managers time to reroute shipments or secure alternative suppliers. Internally, this visibility helps companies achieve 20-35% reductions in inventory by setting safety stock levels based on real-time demand signals, not historical estimates. You can explore how analytics transforms manufacturing supply chains for a deeper analysis.
Building Your Factory’s Data Foundation
An advanced analytics program is only as reliable as the data it runs on. For any CTO or Head of Data, designing the right architecture is the most critical first step. The objective is to bring order to the chaotic streams of information flowing from every corner of the operation.
This process is analogous to building the utility grid for a city. Before constructing buildings (analytics tools), you must first lay the essential infrastructure for power, water, and data. Without this reliable grid, the structures are useless.
Unifying Disparate Data Sources
The first challenge is the variety of data sources in a typical factory. Each system speaks a different language and was designed for a specific purpose, creating data silos that prevent a holistic view of operations.
Key sources that must be integrated include:
- Operational Technology (OT) Data: The real-time pulse of the factory floor, including sensor readings from Programmable Logic Controllers (PLCs), operational status from Supervisory Control and Data Acquisition (SCADA) systems, and workflow data from Manufacturing Execution Systems (MES).
- Information Technology (IT) Data: Business-side data such as inventory levels, supplier details, and customer orders from Enterprise Resource Planning (ERP) platforms, as well as records from Quality Management Systems (QMS) and maintenance logs.
- Unstructured Data: A rapidly growing category that includes images from machine vision systems, text from operator logs, and video feeds from the production line.
Success with manufacturing analytics depends on the ability to pull these varied data types into a single, cohesive structure for cleaning, contextualization, and analysis.
The Shift to a Modern Data Architecture
Historically, manufacturers relied on rigid, on-premise data warehouses. While adequate for structured business reporting, they are ill-equipped to handle the volume, velocity, and variety of modern factory data, particularly real-time sensor streams and unstructured files.
This has driven a shift toward flexible, cloud-based platforms. Cloud architecture provides the scalability to handle massive data loads without large upfront capital investment in hardware.
The goal is not merely to store data, but to make it usable for a range of applications, from simple dashboards to complex machine learning models. A modern data foundation must be flexible enough to serve both current and future needs.
The lakehouse architecture has emerged as the standard model for manufacturing. It combines the low-cost, flexible storage of a data lake (ideal for raw data) with the management and query features of a data warehouse. To understand this model in detail, you can learn more about lakehouse architecture and its suitability for industrial data.
This approach is optimal for manufacturing as it can handle everything from structured ERP data to unstructured video feeds in a unified system, breaking down old barriers between data types and providing a comprehensive operational view.
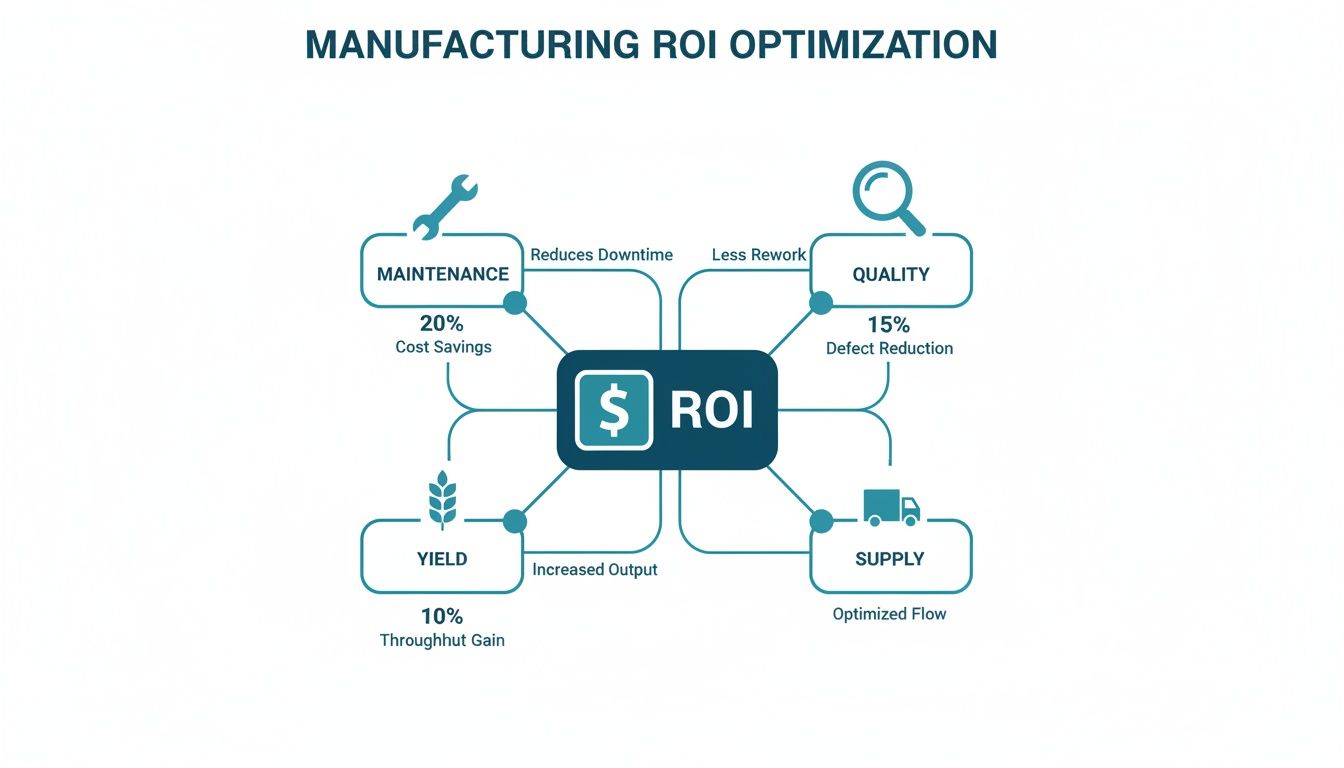
As the diagram illustrates, optimizing maintenance, quality, yield, and supply chain operations are the primary levers for driving financial returns, all powered by a solid data foundation.
How to Measure Success and Calculate ROI
Implementing an analytics program is a significant investment. To secure and maintain budget, its value must be demonstrated. This requires connecting analytics work directly to key business metrics: operational efficiency and the bottom line.
Effective measurement involves tying every tracked metric back to the specific, high-value problem it was intended to solve. This creates a clear link from technology spend to tangible business results, which is the language of leadership.
Tying KPIs to Core Use Cases
For each major analytics application, a handful of metrics will tell the story of its impact. Focus on the vital few that prove a real difference is being made.
Key Performance Indicators by Manufacturing Use Case
This table maps initiatives to the right KPIs, linking specific operational improvements directly to their financial impact.
| Use Case | Primary KPI | Secondary Metrics | Business Goal |
|---|---|---|---|
| Predictive Maintenance | Overall Equipment Effectiveness (OEE) | Mean Time Between Failures (MTBF), Unplanned Downtime Hours | Maximize asset uptime and production capacity |
| AI-Powered Quality Control | First Pass Yield (FPY) | Scrap Rate, Rework Percentage, Cost of Poor Quality (COPQ) | Reduce waste and eliminate defects before they leave the line |
| Yield Optimization | Process Yield / Throughput | Material Consumption Rate, Cycle Time | Increase output using the same amount of raw materials and time |
| Supply Chain Visibility | On-Time In-Full (OTIF) | Inventory Turnover, Days of Supply, Order Lead Time | Improve customer satisfaction and reduce capital tied up in stock |
Focusing on these indicators shifts the conversation from “we implemented analytics” to “our analytics program increased OEE by 12% last quarter.”
Proving the value of analytics is about showing a direct, causal link between a specific initiative—like a predictive maintenance model—and a measurable improvement in a hard metric like OEE.
A Pragmatic Formula for Calculating ROI
Once the right KPIs are being tracked, calculating the return on investment becomes straightforward. The goal is to translate operational improvements into financial terms that can be weighed against project costs.
A simple, effective formula is sufficient for building a compelling business case:
ROI (%) = [ (Financial Gain from Investment - Cost of Investment) / Cost of Investment ] x 100
Let’s break down each component.
1. Quantify the Financial Gains
Convert KPI improvements into dollar values.
- Reduced Downtime: Calculate the cost of one hour of downtime (lost revenue, idle labor, etc.) and multiply it by the number of downtime hours prevented.
- Lower Scrap & Rework: Determine the total material and labor cost of a single scrapped unit and multiply it by the reduction in scrap volume.
- Increased Throughput: If improved OEE allows for the production of 500 more units per week, what is the profit margin on those extra units? That is a direct financial gain.
2. Tally the Total Cost of Investment
A thorough accounting of costs is essential.
- Technology Costs: Include software subscriptions, cloud computing expenses from services like AWS or Azure, and any new hardware such as sensors or gateways.
- Implementation Costs: The cost of data engineering, systems integration, and machine learning model development. For an estimate, a data engineering cost calculator can provide a solid baseline.
- People Costs: Include salaries for data scientists and analysts, plus the time and resources needed for training operators and maintenance teams.
By clearly articulating both the financial gains and the total investment, you can present a data-backed ROI that justifies past work and builds a strong case for future initiatives.
Plotting Your Analytics Maturity Journey
Implementing manufacturing analytics is a long-term evolution, not a single project. Understanding your organization’s current position on this path helps set realistic goals, manage expectations, and plan the next steps. This is a multi-year effort to build a data-driven culture.
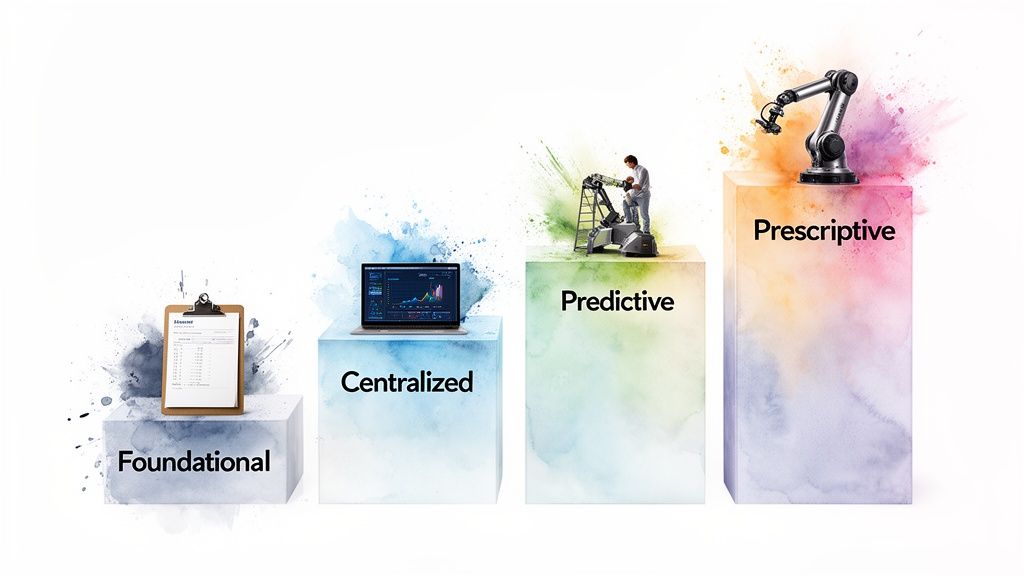
Stage 1: The Foundational Stage
Most manufacturers start here. Data exists but is fragmented across spreadsheets, machine logs, and legacy databases. Reporting is a manual, labor-intensive process of data extraction and consolidation.
- Technology: Basic tools like Microsoft Excel and isolated departmental databases.
- Processes: Reporting is entirely reactive, focused on answering “What happened last week?”
- Skills: Relies on a few key individuals who know how to locate and manipulate the data.
The primary goal at this stage is to establish basic data hygiene and begin asking fundamental performance questions.
Stage 2: The Centralized Stage
In this stage, data silos are broken down. A central data warehouse or lakehouse is established as the single source of truth for key operational data. Standardized, automated dashboards provide managers and executives with a consistent view of operations.
The focus shifts from manual reporting to descriptive analytics. Instead of only asking “what happened,” you can begin exploring “why it happened” by drilling down into reliable, unified data.
This stage represents a significant leap. Data transitions from an administrative burden to a strategic tool for operational visibility and root cause analysis.
Stage 3: The Predictive Stage
With a solid, centralized data foundation, machine learning models can be applied to forecast future events. This is where high-impact use cases like predictive maintenance and AI-powered quality control become feasible.
- Technology: Cloud data platforms like Snowflake or Databricks, machine learning libraries, and advanced analytics tools are utilized.
- Processes: The organization shifts from reactive to proactive, using data to anticipate equipment failures or quality issues.
- Skills: Requires specialized talent, including data scientists and ML engineers, to build, train, and deploy predictive models.
At this level, analytics is no longer a reporting function but an active component of operational decision-making.
Stage 4: The Prescriptive Stage
This is the peak of analytics maturity. AI and machine learning models not only predict outcomes but also recommend the best course of action. For example, the system might suggest specific adjustments to process parameters to maximize yield or automatically reroute a supply chain shipment to avoid a disruption.
The ultimate vision is a “self-optimizing” factory where feedback loops enable systems to make certain decisions autonomously. Reaching this stage requires deep, organization-wide trust in the data, mature governance policies, and a fully data-driven culture.
How to Choose the Right Data Engineering Partner
Implementing advanced manufacturing analytics often requires expertise beyond a typical in-house IT team. A specialized data engineering partner can bridge the gap between concept and a value-generating platform.
The right partner brings more than technical skills; they understand the realities of the industrial environment. They know factory data is messy, complex, and fundamentally different from clean e-commerce or CRM data. The wrong partner can derail a project, exhaust the budget, and deliver a non-functional solution.
Beyond the Sales Pitch
Every consultancy will present a polished deck. Your task is to see past it. You are not hiring a temporary vendor but a partner who can act as an extension of your team. The following criteria are essential for vetting potential partners.
Proven Manufacturing and OT Data Experience
This is non-negotiable. A firm experienced only with IT data from CRM or web analytics will be unprepared for the raw data from industrial machinery.
- Do they speak your language? Ask about their experience integrating data from SCADA systems, MES platforms, and PLCs. Can they discuss industrial protocols like OPC-UA or Modbus? A lack of familiarity with the data source is a major red flag.
- Can they provide evidence? Request a case study from another manufacturer with similar challenges. A proven track record is the best predictor of success.
Technology Agnostic vs. Platform Pushing
A partner should be focused on solving your problem, not selling a specific software platform for which they receive a commission.
Be skeptical of any consultancy that immediately recommends a single platform—be it Snowflake or Databricks—before conducting a thorough discovery of your goals and existing infrastructure.
A true strategic partner is technology-agnostic. They begin by understanding your business objectives, then recommend the tools and architecture best suited to achieve those goals efficiently.
- How do they select a tech stack? Their process should include a discovery phase, an audit of current systems, and a clear rationale for why a particular platform is the best fit for your specific use cases, budget, and team capabilities.
Robust Data Governance and Security Protocols
Manufacturing data contains your company’s most valuable intellectual property—product formulations, machine performance data, and operational strategies. Granting access to this data requires a high degree of trust.
- What are their specific security and governance frameworks? Ask for details on their data handling procedures, access control policies, and any relevant compliance certifications (e.g., ISO 27001). You must be confident in their ability to protect your operational data.
Scalability and Long-Term Support
The initial platform deployment is just the beginning. The real value is realized when the solution is scaled across more production lines, facilities, and use cases. The partner must have a clear vision for post-launch evolution.
- What is their post-launch support model? Discuss their plans for ongoing maintenance, optimization, and—critically—training your team. The end goal should be to empower your internal staff, not to create a permanent dependency on consultants.
- How do they design for growth? They should be able to explain how the initial architecture is built to scale. A system that requires a complete rebuild in two years is a failed investment.
For a more detailed guide on this critical decision, see this resource on how to choose a data engineering company.
Common Questions We Hear in the Field
Even with a clear roadmap, practical questions arise during implementation. Here are common queries with direct answers based on field experience.
What’s the Single Biggest Hurdle to Get Started?
The biggest hurdle is consistently data integration and quality.
Manufacturing data is notoriously complex and siloed across MES, SCADA, ERP, and PLC systems, none of which were designed to communicate with each other. Many well-intentioned projects fail at this initial stage. A robust data pipeline to aggregate, clean, and contextualize this data is a non-negotiable prerequisite. Without it, any analytics or machine learning models built will be unreliable (“garbage-in, garbage-out”), eroding credibility and project support.
How Do We Get People on the Shop Floor to Actually Use This?
Adoption is earned by making jobs easier, not more complex. Start with a focused project that solves a specific, well-known pain point—for example, the one machine that consistently causes unplanned downtime.
The key is to collaborate with frontline staff, not impose a new tool upon them. Solicit operator input during development. Build dashboards that reflect their feedback. When they see that analytics is a practical tool that helps them meet targets and reduces operational headaches, they will become its strongest advocates.
Can We Do This Without Breaking the Bank?
Yes. The approach is to start small, prove value, and then scale. Avoid a “big bang” factory-wide rollout, which is both expensive and high-risk.
Select one production line or one high-impact problem for an initial pilot. This could be monitoring energy consumption or implementing predictive maintenance on a few critical assets. Cloud platforms facilitate this with pay-as-you-go pricing models that eliminate large upfront capital expenditures. A successful pilot with a clear, positive ROI is the most effective way to secure the budget for broader expansion.
Navigating these early stages is a lot easier with the right partner. At DataEngineeringCompanies.com, we offer independent reviews and resources to help you find a data engineering firm that truly understands manufacturing. Check out our guides to find an expert partner and get your project on the right track. https://dataengineeringcompanies.com
Top Data Engineering Partners
Vetted experts who can help you implement what you just read.
Related Analysis
A Practical Guide to Analytics for Manufacturers
Discover how analytics for manufacturers can transform your operations. This guide covers key use cases, data architecture, and choosing the right partner.
A Practical Guide to Analytics for Manufacturing
Unlock operational excellence with our guide to analytics for manufacturing. Learn to implement data strategies that boost efficiency, quality, and ROI.