A Practical Guide to Analytics for Manufacturing
Analytics for manufacturing is the process of converting raw operational data from the shop floor—sensor readings, production counts, error codes—into actionable intelligence. It translates the digital noise from machinery into clear signals that directly impact profitability, efficiency, and product quality.
From Shop Floor Data to Top Floor Decisions

A factory floor generates thousands of disconnected data points every second. By itself, a single temperature spike or vibration anomaly is just noise. When collected and analyzed in context, that data tells a story—revealing patterns that can predict equipment failure, pinpoint production bottlenecks, and uncover hidden capacity.
Manufacturing analytics functions as a universal translator, turning that stream of raw data into operational insights. Think of a car’s dashboard: raw inputs like engine RPM or fuel sensor readings are converted into critical alerts like a “check engine” light or a “miles to empty” estimate. This gives the driver the necessary information to make a sound decision.
Why Analytics Is No Longer Optional
Decisions once based on institutional knowledge and historical averages are no longer sufficient. In a landscape of intense global competition and tight margins, operational precision is critical. Industry 4.0 technologies like the Internet of Things (IoT) and Artificial Intelligence (AI) are not buzzwords; they are fundamental tools for maintaining a competitive edge.
Market growth reflects this reality. Industry research projects the manufacturing analytics market, valued at approximately USD 15.2 billion in 2024, to reach USD 65.8 billion by 2033. This growth is driven by tangible needs like predictive maintenance and real-time quality control.
At its core, manufacturing analytics creates a feedback loop between the physical world of production and the digital world of data. This connection enables continuous improvement, turning every production run into an opportunity to learn and optimize.
The Foundational Shift
Effective analytics requires a fundamental change in data handling. Traditional methods often involved collecting data in batches at the end of a shift or day. Modern analytics, however, thrives on processing information as it happens.
This distinction is crucial for applications like real-time quality alerts or immediate equipment diagnostics. Understanding the difference between stream processing vs. batch processing is a foundational step in building a data strategy that supports modern manufacturing operations. This guide provides a practical framework for transforming disconnected factory data into an intelligent system that drives business performance.
Driving Real Business Value with Analytics
Data analysis that doesn’t solve concrete operational problems is a wasted effort. The true value of analytics in manufacturing emerges when it is applied to the complex, costly, and urgent challenges of the factory floor. The shift is away from reactive decision-making and toward a model where issues are anticipated and operations are optimized proactively.
This transition delivers the most significant returns in three key areas. These are not theoretical concepts; they are proven applications where data directly reduces costs, minimizes waste, and provides a clear competitive advantage.
From Reactive Repairs to Predictive Maintenance
Unplanned downtime is a primary driver of lost profitability. The standard approach has been to either fix equipment after it breaks (reactive) or service it on a fixed schedule, often wasting resources on healthy machinery. Predictive maintenance inverts this model.
By equipping critical assets with sensors that monitor variables like vibration, temperature, and power consumption, analytical models can detect subtle anomalies that signal an impending failure.
- Before Analytics: A critical CNC machine fails during a peak production run. The entire line stops. The consequences include hours of lost output, emergency repair costs, and the risk of delayed customer shipments.
- After Analytics: Weeks before the failure would have occurred, the analytics platform flags a subtle but consistent increase in the machine’s motor temperature. The system automatically triggers a work order, and maintenance is scheduled during a planned changeover. Production continues without interruption.
This proactive capability is a major driver for investment in manufacturing analytics. Industry reports consistently identify predictive maintenance as a top priority for companies seeking to maximize uptime and output. The market drivers for manufacturing analytics underscore the prevalence of this trend.
Pinpointing Flaws with Real-Time Quality Control
Historically, quality control has been a retrospective activity. Defects are typically identified at final inspection, long after significant investment in labor, materials, and machine time has been made on faulty products. The result is high scrap rates and costly rework.
Analytics embeds quality control directly into the production process. By analyzing live data from machine sensors and vision systems, algorithms can identify the specific patterns that lead to defects as they begin to occur.
By shifting from end-of-line inspection to in-process monitoring, you stop making bad parts in the first place. Analytics acts as an early warning system, catching deviations from quality standards the moment they occur.
Optimizing Your Supply Chain and Inventory
A factory is the core of a complex supply chain. Misalignment between supplier deliveries, production schedules, and customer demand leads to two undesirable outcomes: excess inventory that ties up capital, or stockouts that result in lost sales and customer dissatisfaction. Analytics helps construct a more intelligent, connected supply chain.
By integrating data from ERP systems with real-world supplier lead times and accurate demand forecasts, a dynamic production model can be created. This model ensures sufficient raw material is available to meet schedules without tying up capital in excessive stock.
Impact of Analytics Across Manufacturing Use Cases
The following table illustrates how analytics fundamentally changes core operational areas, shifting the paradigm from reactive guesswork to proactive, data-informed action.
| Operational Area | Traditional Approach (Without Analytics) | Modern Approach (With Analytics) | Primary Business Outcome |
|---|---|---|---|
| Maintenance | Reactive repairs after failure; fixed schedules. | Data-driven failure prediction and proactive work orders. | Maximized Uptime & Reduced Costs |
| Quality Control | Manual, end-of-line inspections; high scrap rates. | Real-time defect detection and root cause analysis. | Improved First Pass Yield & Lower Waste |
| Inventory | Static forecasts; risk of stockouts or overstock. | Dynamic scheduling based on integrated demand data. | Lean Inventory & Resilient Supply Chain |
The consistent theme is that data-driven insights enable anticipation and prevention, leading directly to a more efficient, profitable, and resilient operation.
Building Your Manufacturing Data Foundation
Successful manufacturing analytics is not primarily about advanced AI models or sophisticated dashboards. It begins with a solid data foundation. Similar to constructing a building, a stable foundation is a prerequisite for any complex structure. In analytics, this foundation is a single, trustworthy source of all operational data.
The primary challenge is that manufacturing data is typically fragmented and siloed, existing in two distinct domains.
On one side is Operational Technology (OT) data, the high-velocity information streaming from the factory floor. This includes signals from PLCs, SCADA systems, and IoT sensors that describe machine operations on a second-by-second basis.
On the other side is Information Technology (IT) data. This is structured business information from systems like the Manufacturing Execution System (MES), Enterprise Resource Planning (ERP), and Product Lifecycle Management (PLM). This data provides critical context, such as which product is being manufactured, which work order is active, and what the quality specifications are.
Uniting IT and OT Data Streams
The core value of manufacturing analytics is realized when these two data worlds are integrated into a single source of truth. When real-time machine vibration data (OT) can be analyzed alongside the maintenance history for that asset from an ERP system (IT), the ability to predict failures is unlocked.
The following diagram illustrates this flow, connecting disparate data sources to drive business outcomes.
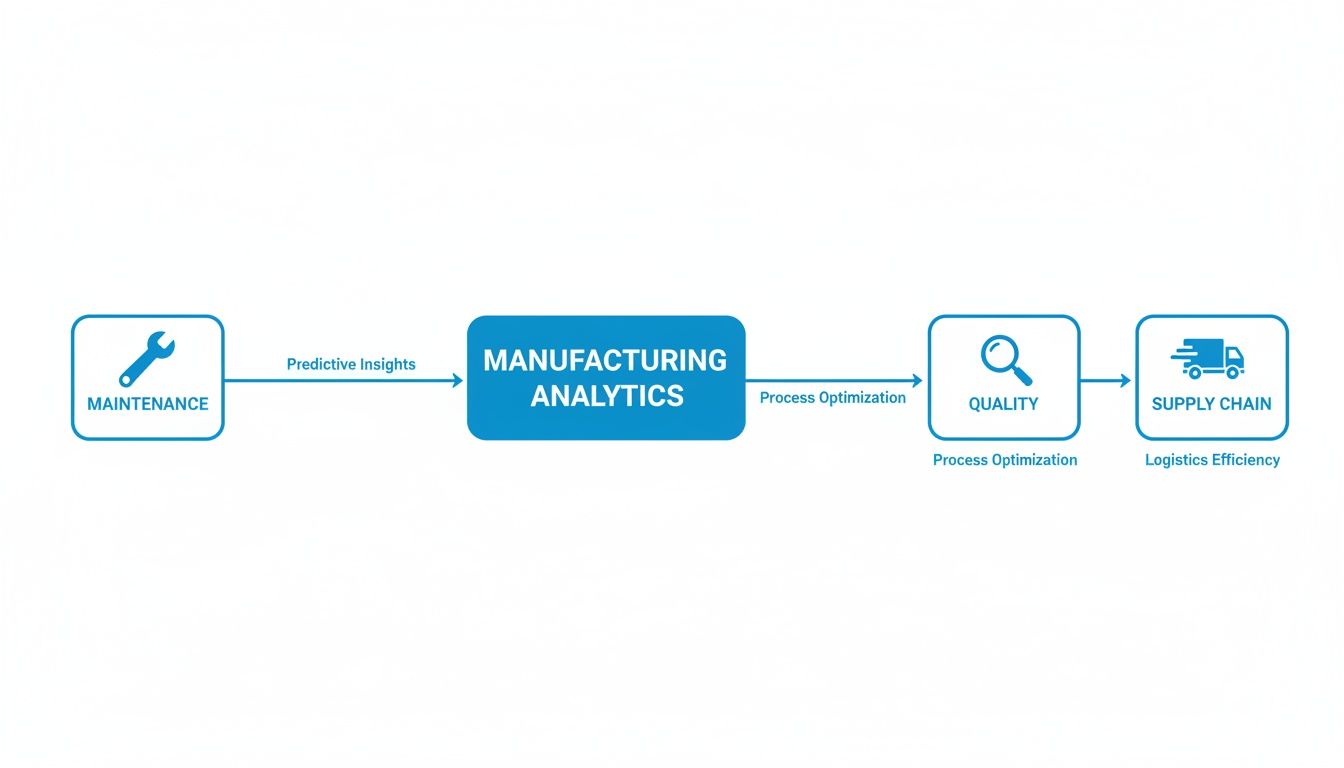
As shown, a unified data view directly enables improvements in core functions like maintenance, quality control, and supply chain logistics.
Modern tools have made this integration more achievable. Streaming technologies are now used to move OT data from the network edge—the factory floor—into a central cloud platform in near real-time. This continuous flow is essential for timely alerts and immediate analysis. Merging these sources effectively is a specialized discipline; for further guidance, review established data integration best practices.
Choosing Your Central Data Repository
Once integrated, this data requires a central repository. The two most common architectural choices are a data lake and a data warehouse.
-
Data Lake: A massive storage repository that can ingest any type of data—structured, unstructured, raw sensor readings, images—in its native format. It is cost-effective for storing large volumes and serves as an ideal environment for data scientists to explore raw data for new patterns.
-
Data Warehouse: A highly organized repository where data is cleaned, structured, and cataloged before storage. This approach is optimized for fast, reliable queries, making it the ideal source for BI dashboards and standard reports used by management.
Note: Modern data strategies often do not require an “either/or” choice. The “Lakehouse” architecture is gaining traction as it combines the flexibility of a data lake with the structure and performance of a data warehouse, offering a unified platform for diverse analytics workloads.
The chosen architecture must be scalable, secure, and reliable. It must handle high-volume data streams from thousands of sensors while ensuring strict access control. The quality of insights is directly dependent on the quality of the underlying data.
Building this foundation is the most critical phase of any analytics project. A well-designed data infrastructure provides the clean, contextualized fuel that powers every valuable insight. Without it, you are merely analyzing noise.
Choosing the Right Analytics Platform and Partner
Selecting the right technology and partner is a critical decision that will determine the success of a manufacturing analytics program. The central question is whether to build a custom platform or buy a commercial solution.
Each path involves significant trade-offs. The optimal choice depends on your team’s skills, budget, and long-term strategic goals. This is an investment in a core operational capability, not just a software purchase.
To Build or To Buy Your Analytics Platform
The initial decision is whether to build a custom analytics platform or purchase an existing market solution.
A custom build offers maximum flexibility, allowing every feature to be tailored to unique processes. However, this requires a significant, ongoing investment in a highly skilled team of data engineers and scientists. It is a long-term commitment that may take years to deliver a return on investment.
Conversely, purchasing an off-the-shelf platform can dramatically accelerate implementation. These solutions often include pre-built connectors for common industrial systems (e.g., PLCs, MES) and ready-to-use analytics modules for applications like predictive maintenance. The trade-off may involve adapting some internal processes to align with the platform’s workflow, alongside recurring licensing fees.
For most manufacturers, a hybrid approach is the most pragmatic path. Start with a commercial platform to address the most pressing 80% of challenges quickly. Then, leverage its customization tools or APIs to develop targeted solutions for the remaining 20%—the specific operational issues that provide a unique competitive advantage.
Key Considerations for Cloud Platforms
While most modern manufacturing analytics platforms are cloud-based, they are not all designed to handle industrial data equally. The type of data you work with should be a primary factor in your decision.
-
Structured Machine Data: For high-volume, time-series data from PLCs and sensors (e.g., temperature, pressure, vibration), a platform optimized for rapid data ingestion and querying is essential. Platforms like Snowflake or Databricks are engineered to handle these massive, structured datasets efficiently.
-
Unstructured Visual Data: If quality control relies on machine vision, you will be processing a large volume of images and videos. This requires a platform with robust object storage and specialized AI/ML services for image recognition, which are core strengths of major cloud providers like AWS, Azure, and Google Cloud.
This diagram of Snowflake’s Manufacturing Data Cloud illustrates a modern platform architecture. It emphasizes the integration of data not just from the factory but from across the entire value chain, including suppliers, distributors, and customers.
The focus is on a connected ecosystem. An effective platform analyzes internal operations while also pulling in external data to provide a complete business picture.
Your Vendor Selection Checklist
Choosing the right partner is as critical as selecting the right technology. The manufacturing analytics market is valued between USD 9 and 16 billion, attracting a wide range of vendors from industrial giants like Siemens and Rockwell Automation to IT leaders like Microsoft and SAP. Reviewing major players and market trends can provide a useful overview.
Use this checklist to evaluate potential vendors:
- Deep OT Connectivity: Can they reliably connect to your specific PLCs, SCADA systems, and historians? Request case studies with equipment similar to yours.
- Proven Industry Expertise: Does the vendor understand the difference between discrete and process manufacturing? A lack of domain knowledge will prevent them from delivering tangible business value.
- Scalability and Performance: The platform must support a single production line today and scale to a global footprint tomorrow without degradation in performance.
- Total Cost of Ownership (TCO): Look beyond the initial license fee. Factor in implementation services, data storage costs, team training, and ongoing support contracts.
- Red Flags to Watch For: Be skeptical of any vendor promising “plug-and-play” AI without significant data integration effort—it does not exist. A team with no direct factory floor experience is another major red flag. Effective manufacturing analytics requires a deep understanding of both technology and operations.
A Phased Roadmap for Successful Implementation
Even a superior analytics platform will fail without a strategic implementation plan. Many initiatives fail not due to technology, but due to a flawed approach. The most common mistake is attempting to solve every problem on every production line simultaneously.
This “boil the ocean” strategy leads to team burnout, budget overruns, and a lack of tangible results.
A successful analytics for manufacturing implementation is a methodical, phased process that delivers value at each stage. This approach builds momentum, secures stakeholder buy-in, and ensures progress. By breaking the project into manageable phases, you can demonstrate ROI quickly and avoid overwhelming your organization.
Phase 1: Start Small with a High-Value Pilot
Resist the temptation to start with a large-scale project. The initial goal is to identify one specific, high-impact problem that is a known pain point and has a clear financial cost. Unplanned downtime on a single, critical asset is an ideal candidate for a pilot project.
Focus all initial efforts on solving that one problem. A narrow scope allows you to prove the concept quickly and resolve technical challenges in a controlled, low-risk environment. A successful pilot that reduces downtime by even 10-15% provides a powerful success story and the justification needed for a wider rollout.
Phase 2: Build the Foundational Data Infrastructure
With a successful pilot, the next phase is to build a scalable data foundation to support future initiatives. This involves formalizing the data integration patterns tested in Phase 1.
The objective is to create a robust, repeatable pipeline to move OT data from the plant floor and IT data from ERP and MES into a centralized platform. The focus here is on technical architecture rather than immediate business results. The goal is to establish a reliable “single source of truth” for the organization, which prevents redundant effort in future projects.
A common pitfall is treating data infrastructure as a pure IT project. Success requires a tight partnership between IT, which understands data architecture, and OT engineers, who understand the meaning and context of the machine data.
Phase 3: Scale Proven Solutions Systematically
With the foundation in place, you are ready to expand. Take the solution developed in the pilot and deploy it across other similar assets or production lines. Because the approach has been validated and the data infrastructure is in place, this scaling phase should be faster and more predictable.
The key is a systematic rollout. Move from one facility or line to the next, adapting the solution as needed while adhering to the core framework. This methodical expansion ensures quality and provides opportunities to gather feedback for continuous improvement.
Phase 4: Foster a Data-Driven Culture
Technology is only one part of the equation. A platform alone does not create a data-driven organization; people do. This final, ongoing phase focuses on change management. True transformation occurs when operators, engineers, and plant managers begin to trust the data and use it to guide their daily decisions.
Driving this cultural shift requires deliberate effort:
- Invest in Data Literacy: Provide training that enables employees at all levels to interpret dashboards, ask critical questions of the data, and understand what the analytics reveal.
- Create Cross-Functional Teams: Break down organizational silos. Establish “analytics pods” that bring together OT engineers, IT data specialists, and business line managers to solve problems collaboratively.
- Celebrate Wins Publicly: When an insight from data leads to a tangible improvement—such as reduced scrap or increased OEE—ensure the success is communicated widely. This builds momentum and encourages broader participation.
Measuring Success and Calculating Real ROI

An investment in manufacturing analytics must be justified with measurable results. To secure and maintain budget, you must move beyond anecdotal improvements and focus on hard metrics that directly impact the bottom line.
Success is a quantifiable improvement in factory-floor performance.
The first step is to establish a clear baseline. Before implementing any new analytics tool, capture at least three to six months of historical data for the specific KPIs you intend to improve. This pre-implementation snapshot serves as the objective benchmark against which all future gains will be measured.
Key KPIs for Manufacturing Analytics
The impact of manufacturing analytics is most evident when focused on the operational metrics that drive business performance. The table below outlines critical KPIs and how an effective analytics strategy can improve them.
| KPI | What It Measures | How Analytics Improves It |
|---|---|---|
| Overall Equipment Effectiveness (OEE) | The standard for manufacturing productivity, combining availability (uptime), performance (speed), and quality (first-pass yield). | Analytics identifies root causes of downtime, detects micro-stoppages affecting speed, and flags process deviations that lead to defects. |
| Mean Time Between Failures (MTBF) | The average time a machine operates before breaking down. A core measure of asset reliability. | Predictive maintenance, driven by real-time sensor data, enables repairs before failure occurs, directly increasing MTBF. |
| First Pass Yield (FPY) | The percentage of products manufactured correctly the first time, without rework. | By identifying process anomalies in real time, analytics can alert operators to make immediate corrections, preventing the production of defective units. |
| Scrap Rate | The percentage of raw material wasted during production. A direct impact on profitability. | Analytics can pinpoint the specific machine settings, material inconsistencies, or environmental factors that cause defects, enabling targeted waste reduction. |
Tracking these KPIs is how you demonstrate tangible business value. Vague promises are insufficient; hard data commands attention.
To effectively demonstrate value, tie a percentage improvement in a core KPI directly to a dollar amount. For instance, show that a 5% reduction in scrap rate on a high-volume line translates to $250,000 in annual material cost savings.
Building the Business Case and Calculating ROI
With established baselines and target KPIs, building a business case is a straightforward process. The formula is simple: quantify the financial value of the improvements and subtract the total cost of the analytics investment.
This calculation is only valid if the underlying data is clean and reliable. For any large-scale implementation, this requires establishing clear data ownership and quality standards. This is where a structured approach becomes vital, a discipline further detailed in the fundamentals of data governance consulting services.
A comprehensive ROI calculation must include all costs: software licenses, implementation services, new hardware, and the time invested by your internal team. On the benefits side, sum the financial gains from increased throughput, reduced maintenance expenses, lower material waste, and decreased labor for rework. This data-backed approach transforms your analytics program from a perceived “cost center” into a proven driver of profitability.
Frequently Asked Questions
These are the most common practical questions that arise when organizations consider implementing manufacturing analytics.
The goal is to provide clear, direct answers to help you proceed with confidence.
How Do We Start If Our Factory Data Is a Mess?
This is the standard starting point for nearly every manufacturer. The most common mistake is attempting to clean up all data at once. This “boil the ocean” approach is the primary reason analytics for manufacturing initiatives fail.
Instead, select one high-value problem and focus exclusively on it. Unplanned downtime on a critical production line is a classic, high-impact starting point.
Concentrate all initial data cleansing and integration efforts only on the sources required to solve that single problem. This might involve only the sensor data from one machine and its maintenance history from your ERP. This approach proves value quickly, builds momentum, and justifies a broader data governance strategy for the future.
What Skills Do We Actually Need On Our Team?
A successful implementation cannot be solely an IT or an engineering project. It requires a cross-functional team.
The team should include a blend of specific expertise:
- OT Expertise: Plant engineers who understand the machinery are essential. They provide the physical context for what the sensor data means.
- IT and Data Engineering: These are the technical experts who connect disparate systems and ensure a reliable flow of data from the shop floor to the cloud platform.
- Analytics Talent: Data scientists and analysts build the predictive models, identify patterns, and extract actionable insights from the data.
- Business Sponsor: A leader is needed to define success metrics, remove organizational barriers, and ensure the project remains aligned with measurable business outcomes.
It is common to engage a specialized partner to fill initial gaps, particularly in data science and engineering, while building internal capabilities.
Can Analytics Work With Our Older, Legacy Equipment?
Yes. The misconception that analytics requires a brand-new, fully automated factory is a significant barrier to adoption.
Many older machines can be retrofitted with inexpensive, modern IoT sensors to monitor variables like vibration, temperature, and power consumption.
These sensors provide a stream of new data to your analytics platform, effectively making legacy assets “smart.” The real value is unlocked when this new sensor data is combined with existing contextual information from your MES or historian. This integration creates a comprehensive view of asset health, bridging the gap between old and new technology.
Finding the right partner with proven experience is the key to getting through these challenges. DataEngineeringCompanies.com offers independent rankings and resources to help you choose the right data engineering consultancy with confidence. Check out our 2025 Expert Rankings to simplify your vendor search and get your analytics journey on the right track.
Top Data Engineering Partners
Vetted experts who can help you implement what you just read.
Related Analysis
A Practical Guide to Analytics for Manufacturers
Discover how analytics for manufacturers can transform your operations. This guide covers key use cases, data architecture, and choosing the right partner.
Analytics in Manufacturing: A Practical Guide to Turning Data into ROI
Analytics in Manufacturing: Learn how analytics in manufacturing drives ROI through predictive maintenance, quality control, and optimized supply chain.