A Practical Guide to Creating a Data Warehouse That Delivers Business Value
Before writing a single line of code, the foundation of a successful data warehouse must be laid. This isn’t the exciting part with novel tech, but it’s the part that prevents your project from becoming expensive, unused shelf-ware. It’s about creating a strategic blueprint first.
Your Strategic Blueprint for Building a Data Warehouse
Jumping straight into demos with Snowflake, Databricks, or Amazon Redshift is a classic, and often costly, mistake. Successful projects start with a blueprint that anchors the entire effort to tangible business outcomes—the kind of results the C-suite actually cares about.
The goal is to shift the conversation. Instead of saying, “We need a data warehouse,” the discussion should sound more like, “We need to determine why customers are churning to boost retention by 5%.” This change connects the data project directly to revenue, efficiency, or cost savings.
First, Define Clear Business Objectives
The first step is to get specific about what the business needs to achieve. “Better reporting” is a common but uselessly vague starting point. You must push for quantifiable, concrete outcomes.
Here are a few real-world examples to frame the conversation:
- Sales & Marketing: “Can we pinpoint our most profitable customer segments to reallocate budget from broad, underperforming ad campaigns?”
- Operations: “How can we reduce supply chain delays by gaining a near real-time view of inventory and shipping data?”
- Finance: “Can we automate our financial consolidation reports to close the books three days faster each month?”
Asking these questions forces a practical discussion. It provides a clear target and helps define a manageable initial scope so you’re not trying to boil the ocean from day one.
A data warehouse built without clear business objectives is like a ship without a rudder. It might be a masterpiece of engineering, but it will drift aimlessly without ever reaching a valuable destination. The blueprint provides that direction.
Align Stakeholders and Audit Your Data Landscape
With objectives set, it’s time to get the right people in the room and secure buy-in. This means identifying executive sponsors who will champion the project, business analysts who understand the data’s real-world context, and the technical teams who will build and operate the system. Early alignment is crucial for removing roadblocks later.
At the same time, conduct a pragmatic audit of your current data sources. This is not a theoretical exercise; it’s about assessing the quality, volume, and velocity of data from sources like:
- Internal Databases: Your core transactional systems, like PostgreSQL or SQL Server.
- SaaS Platforms: Critical data living in tools like Salesforce, HubSpot, or Google Analytics.
- APIs and Logs: The semi-structured data from application logs or third-party APIs.
This audit provides a realistic picture of the data integration work ahead and helps shape your roadmap. With the global data warehousing market having surpassed $30 billion in 2025, the need to wrangle and analyze disparate data sources is only growing. This upfront planning ensures your project is a well-defined strategy, an essential piece of building any modern data stack.
Choosing Your Cloud Data Warehouse Architecture
With your strategic blueprint locked in, it’s time to make the most critical technical decision: selecting the platform that will become the engine for your analytics operation. This isn’t just a feature comparison. Your choice will define your cost structure, performance limits, and the types of questions your business can answer.
The market is crowded, but a few heavyweights dominate: Snowflake, Databricks, Amazon Redshift, and Google BigQuery. Each is built on a different philosophy, and understanding those differences is key to cutting through the marketing.
Understanding Core Architectural Philosophies
The single biggest innovation in modern data platforms is the separation of storage and compute. Pioneered by Snowflake, this model lets you scale data storage capacity independently from processing power.
Need to load a petabyte of raw data? Storage is cheap. Need to run a massive query for the finance team’s end-of-quarter report? You can spin up a large compute cluster for that specific task, then shut it down the moment it’s done. You only pay for what you use, when you use it.
This is a major departure from the traditional, tightly coupled architecture that a platform like Amazon Redshift was originally known for. While it has evolved dramatically with its RA3 instances and serverless options, its roots are in provisioning clusters where compute and storage are linked. This design can be a performance beast for predictable, high-concurrency workloads but offers less flexibility for the spiky, unpredictable query patterns common in many businesses.
The move to cloud-native platforms has been a game-changer. In 2025, the Data Warehouse as a Service (DWHaaS) market was valued at over $8 billion and is projected to explode to $43.16 billion by 2035. This massive shift is happening for a reason. You can read more about this rapid market expansion on Precedenceresearch.com.
The Rise of the Lakehouse Paradigm
Databricks introduced the Lakehouse, a paradigm designed to offer the best of both worlds: the low-cost, flexible storage of a data lake combined with the performance and reliability (ACID transactions) of a traditional data warehouse. It’s built from the ground up to handle structured, semi-structured, and unstructured data in a single system, typically on open table formats like Delta Lake or Apache Iceberg.
So, when should you lean toward a lakehouse?
- Heavy AI/ML Workloads: If your primary goal is feeding data directly into machine learning models with tools like Spark, a lakehouse is a more natural and efficient fit.
- Diverse Data Types: When you’re dealing with everything from clean CSV files to messy JSON logs and need to analyze it all without a painful ETL process, a lakehouse provides that versatility.
- Streaming and Real-Time Data: For use cases that demand processing real-time data streams alongside historical batch data, the lakehouse architecture shines.
However, for classic business intelligence and reporting—where analysts need fast queries on highly structured data—a dedicated cloud data warehouse like Snowflake or BigQuery often wins for its sheer simplicity and query optimization.
This decision tree gives a high-level view of the thought process, starting from the core business need and moving through stakeholder alignment.
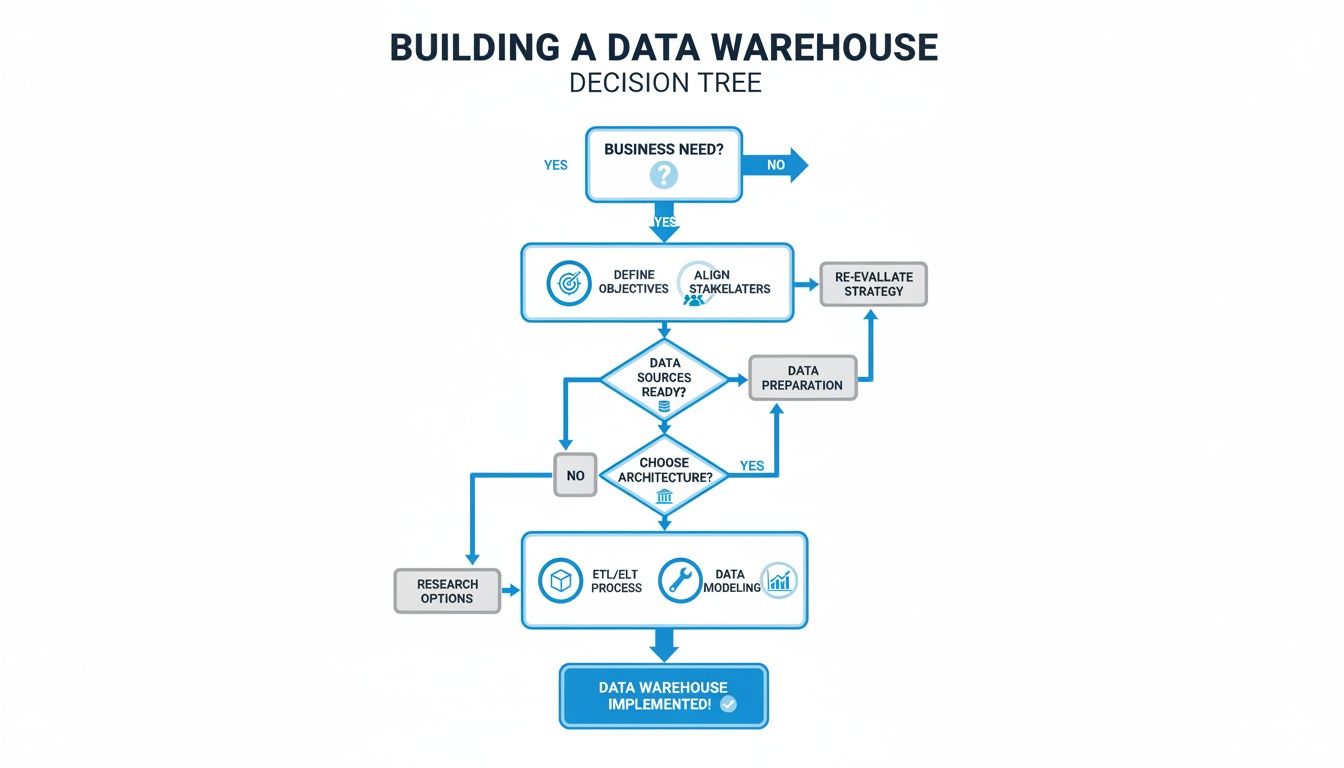
As the visual shows, you must nail down business requirements and get stakeholder alignment before you start talking about specific platforms.
Cloud Data Warehouse Platform Comparison
Here’s a breakdown of the major players, their core philosophies, and where they fit best.
| Platform | Core Architecture | Best For | Pricing Model | Key Differentiator |
|---|---|---|---|---|
| Snowflake | Multi-cluster, shared data | Business Intelligence, ad-hoc analytics, data sharing | Credit-based (compute) + per-TB storage | True separation of storage & compute, data marketplace |
| Databricks | Lakehouse (on a data lake) | AI/ML, data science, streaming analytics, ETL/ELT | Databricks Unit (DBU) based on compute usage | Unified platform for data engineering & data science |
| Amazon Redshift | Massively Parallel Processing (MPP) | Predictable BI workloads, operational reporting (AWS ecosystem) | Per-node or serverless compute + storage | Deep integration with the AWS ecosystem, performance |
| Google BigQuery | Serverless, distributed query engine | Large-scale analytics, ad-hoc queries, ML (GCP ecosystem) | Pay-per-query or flat-rate compute slots | Truly serverless architecture, built-in ML capabilities |
This table is a starting point. The best choice always depends on a deeper dive into your specific needs, but it provides a solid framework for initial conversations.
A Practical Decision-Making Framework
Don’t get caught up in hype. Choosing the right platform is a pragmatic exercise, balancing technical requirements, budget, and team skills.
The best data warehouse platform is not the one with the most features, but the one that best aligns with your team’s skills, your company’s budget, and your most critical business use cases. A pragmatic choice will always outperform a fashionable one.
Here’s what you should be evaluating:
- Primary Workloads: Are you building interactive BI dashboards (point to Snowflake/BigQuery)? Or are you focused on complex data science and ML (point to Databricks)? Maybe it’s all about stable, operational reporting (a classic Redshift strength).
- Existing Tech Ecosystem: If you’re an all-in AWS shop, Redshift offers a seamless, native fit. If your world revolves around the Google Cloud Platform, BigQuery is the obvious front-runner.
- Team Skill Set: Is your team full of SQL wizards, or are they more comfortable in Python and Spark? The answer will have a huge impact on the learning curve and time-to-value.
- Pricing Model: You must run the numbers. Compare BigQuery’s pay-per-query model against Snowflake’s credit-based consumption. Build a few cost models based on your expected query patterns to avoid surprises on your first bill.
By grounding your decision in these real-world factors, you’ll choose an architecture that isn’t just powerful on paper, but is a strategic fit that will work for your business for years to come.
Designing and Building Your Data Pipelines
A perfectly designed data warehouse is useless without data flowing through it. It’s just an empty, expensive database. The success of your project hinges on the quality and reliability of your data pipelines—the plumbing that moves information from all your sources to a place where it’s ready for analysis.
This is where the real engineering begins.
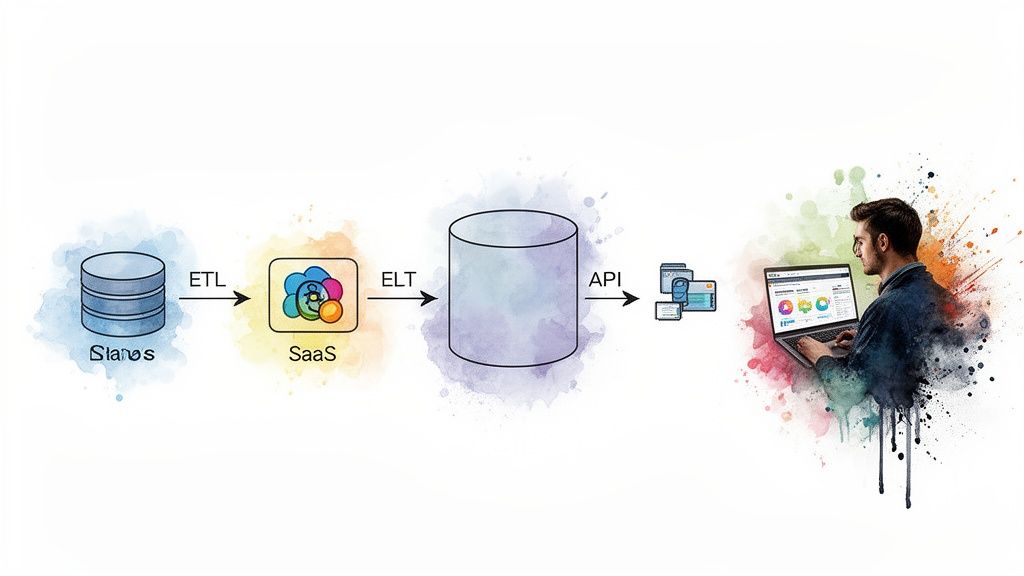
The diagram above gives a high-level look at this flow, taking raw data on the left and moving it through processing and transformation until it lands in the hands of an analyst on the right.
The Modern Debate: ETL vs. ELT
For decades, the standard was ETL (Extract, Transform, Load). You pulled data from a source, cleaned and reshaped it on a separate server, and then loaded the final, pristine version into the warehouse. This approach made sense when storage and processing power were expensive and tightly linked.
The cloud flipped that model on its head.
The modern approach is ELT (Extract, Load, Transform). You pull raw data from the source and load it directly into your cloud data warehouse with minimal fuss. All the heavy lifting—the cleaning, joining, and aggregating—happens right inside the warehouse, taking full advantage of its massive, scalable compute power.
This shift to ELT isn’t just a technical detail; it’s a strategic advantage. It gives you the flexibility to store raw, unaltered data, allowing you to re-process it for new use cases later without having to go back to the source systems. You never know what questions you’ll need to answer tomorrow.
For a deeper dive into the nuts and bolts of this process, our comprehensive guide on how to build data pipelines lays out more practical steps and best practices.
Choosing Your Pipeline Toolkit
Building pipelines means stitching together a few key components. The tools you pick will define how automated, reliable, and maintainable your data operation becomes.
-
Ingestion Tools: These tools specialize in moving data from Point A to Point B.
- Fivetran & Airbyte: For common SaaS sources like Salesforce, Google Analytics, or Stripe, managed connectors are a no-brainer. They automatically handle API changes, schema drift, and incremental updates, saving your engineers from countless headaches.
- Custom Scripts: You can’t escape custom code entirely. For proprietary internal systems or unique APIs, you’ll still need to write scripts, usually in Python, managed by an orchestrator.
-
Transformation Frameworks: Once raw data lands in the warehouse, you need a way to model it into something useful.
- dbt (Data Build Tool): This has become the undisputed king of the “T” in ELT. It lets your team write transformations in pure SQL, while dbt itself handles dependency management, testing, and documentation. It’s what turns messy, raw tables into clean, analyst-ready datasets.
-
Orchestration Engines: Think of these as the conductors of your data symphony. They ensure every task runs in the right order, at the right time, and handles failures gracefully.
- Airflow: The open-source powerhouse. It offers immense flexibility for complex, code-heavy workflows. It’s ideal for teams with strong engineering skills who need to manage dependencies across dozens of systems.
- Dagster & Prefect: These are the newer generation of orchestrators, offering more modern developer experiences and data-aware features that can make debugging and maintenance less painful.
Pipeline in Action: A Real-World Example
Let’s make this tangible. Imagine your goal is to build a sales performance dashboard that combines opportunity data from Salesforce with payment information from Stripe.
-
Extract & Load (The “EL”): First, you’d configure connectors in Fivetran for both Salesforce and Stripe. Within minutes, Fivetran creates the tables in your Snowflake warehouse and starts syncing the raw data, automatically dealing with API authentication and schema creation. You schedule this to run hourly.
-
Transform (The “T”): Next, an Analytics Engineer writes a few dbt models. One model cleans the raw
opportunitytable from Salesforce. Another cleans thechargestable from Stripe. The final model joins them on a customer ID to create a wide table calledfct_sales_performancewith key metrics likedeal_close_date,deal_amount, andpayment_status. -
Orchestrate: An Airflow DAG (a script defining the workflow) ties it all together. It first triggers the Fivetran syncs via an API call. Once both are complete, it runs the
dbt buildcommand, which executes your transformation models in the correct order. If any step fails, it’s configured to send a Slack alert to the data team.
This automated flow ensures that the BI dashboard always has fresh, reliable data without manual intervention.
Handling Modern Data Types
Your pipelines won’t always be dealing with neat rows and columns. Modern data, especially from application logs and APIs, is often semi-structured, like JSON.
This is where platforms like Snowflake and BigQuery shine. They have native support for this kind of data. You can load a raw JSON object directly into a VARIANT or JSON column.
From there, you use simple SQL functions to parse and extract the specific fields you need during the transformation stage. This avoids brittle, upfront parsing logic and lets you adapt easily as the JSON structure changes. Your ELT process remains simple: load the raw JSON, then transform it with SQL right inside the warehouse.
Giving Your Data Structure and Rules with Modeling and Governance
Once you’ve piped raw data into your warehouse, you’re not done. You just have a large, messy collection of tables. It’s a technical achievement, but not a business asset. To turn that raw data into a trusted source for decision-making, you need two crucial disciplines: data modeling and data governance. This is the step that transforms a powerful database into a reliable analytics engine for the company.

Think of it like the image above—you need to put your data under a microscope, map out how it all connects, and wrap it in the right security and rules to ensure everyone can trust it.
Choosing the Right Data Model
Data modeling is about giving your data a logical shape, organizing tables so they’re optimized for fast, intuitive analysis. While many techniques exist, dimensional modeling approaches have stood the test of time, even in the cloud era.
The most common and practical approach is the star schema. It’s built around a central fact table, which holds your key business metrics—the numbers, like sales_amount or units_sold. This fact table is connected to several dimension tables, which hold the context—the “who, what, where, when”—like product_name, customer_region, or transaction_date. It’s a simple structure that BI tools love and analysts can understand quickly.
You might also hear about the snowflake schema, a more normalized version of the star schema where dimension tables are broken down further. For instance, a dim_product table might be split into separate tables for brand and category. While this can save a little storage space, it almost always makes queries more complex and slower due to the increased number of joins.
My advice? Stick with the star schema for 95% of modern analytics use cases. The simplicity pays dividends in query performance and user comprehension. People using tools like Tableau or Power BI will find it far more natural to work with. Only deviate if you have a specific, compelling reason for the added complexity of a snowflake model.
If you want to dig deeper into the architectural trade-offs, our guide on data warehouse modeling breaks down the pros and cons with more detailed examples.
Why You Need a Semantic Layer for Consistency
Even with a perfect star schema, a classic problem persists: different teams define the same metric in different ways. Is “net revenue” calculated before or after returns? Does “active user” include people on a free trial? Without a single source of truth for business logic, your reports will quickly become a mess of conflicting numbers.
This is exactly what a semantic layer is designed to prevent.
Think of it as a translation layer between the physical tables in your warehouse and the end-user’s reporting tool. It’s where you define all your key business logic—metrics, calculations, and dimensions—in one central, reusable place.
A few excellent tools have emerged to build this:
- LookML (from Looker): A powerful, code-based modeling language where you can define dimensions, measures, and relationships in a version-controlled way.
- dbt’s Semantic Layer: This integrates directly with your dbt transformation workflows. You define a metric like
revenueonce, and that definition is consistently applied across every downstream tool that connects to it.
By building a semantic layer, you ensure that when the finance team pulls a report on “revenue” and the marketing team does the same, they are looking at the exact same number, calculated the exact same way.
A Practical Checklist for Data Governance
Data governance often gets a bad rap as bureaucratic and restrictive. But good governance isn’t about locking data down; it’s about building trust. If users can’t trust the data, they won’t use it. Launching a data warehouse without a clear governance plan is a recipe for failure.
Here’s a no-nonsense checklist to get you started:
- Use Role-Based Access Control (RBAC): Start with the principle of least privilege. Define roles like
sales_analyst,finance_manager, ordata_engineer, and grant permissions only to the data they absolutely need. A sales analyst has no business seeing raw employee salary data, and RBAC is how you enforce that. - Mask or Anonymize Sensitive Data: Systematically identify all Personally Identifiable Information (PII) in your warehouse—names, emails, phone numbers. Use your platform’s built-in features, like dynamic data masking in Snowflake, to hide this information from unauthorized users. They’ll see
xxxx-xxxxinstead of a real phone number, while a privileged user sees the actual data. - Map Out Data Lineage: This is non-negotiable for building trust. Users must be able to see the journey a piece of data took from its raw source all the way to their dashboard. Modern tools like dbt are brilliant at this, automatically generating lineage graphs that show every transformation step. It makes debugging much easier and proves to your users that the numbers are sound.
- Launch a Data Catalog: A data catalog is like a search engine for your data warehouse. It provides business definitions, identifies data owners, and can display data quality scores. This empowers business users to find and understand the data they need on their own, which is key to creating a self-service analytics culture.
Assembling Your Team and Managing the Project
A powerful data warehouse platform is only one piece of the puzzle. The real engine behind a successful project is the team you put in place to design, build, and operate it. Building a data warehouse is a major business initiative that needs a smart mix of strategic, technical, and analytical minds to turn raw data into something valuable.
Defining Your Core Data Team Roles
In a modern data stack, the lines between roles can be blurry, but three core functions must be filled. Getting the right people in these seats is fundamental.
-
The Data Architect: The master planner. They translate high-level business goals into a technical blueprint. They make the big calls on which platform to use, the data modeling strategy (like whether a star schema is the right fit), and the overall governance framework that keeps everything secure and organized.
-
The Data Engineer: The builder. Data engineers construct the data pipelines that are the lifeblood of your warehouse. They work with tools like Fivetran, Airbyte, dbt, and Airflow to pull data from sources, load it into the warehouse, and run first-pass transformations. Their world is about reliability, testing, and data availability.
-
The Analytics Engineer: A critical, newer role that acts as a translator. Analytics engineers live inside the warehouse. They take the raw data pipelines built by data engineers and use tools like dbt to refine, model, and document that data into pristine, business-ready datasets. They bridge the gap between raw technical data and the clean, trusted insights business users crave.
Building an effective team requires a clear understanding of how these roles interact. The table below breaks down the primary responsibilities and skills needed for a successful data warehouse project.
Data Warehouse Project Team Roles and Responsibilities
| Role | Primary Focus | Key Skills and Tools |
|---|---|---|
| Data Architect | High-level strategy, platform selection, governance, and data modeling design. | SQL, Python, Cloud Platforms (AWS, GCP, Azure), Data Modeling (Kimball, Inmon), Data Governance Frameworks. |
| Data Engineer | Building and maintaining robust data ingestion and transformation pipelines. | ETL/ELT Tools (Fivetran, Airbyte), SQL, Python, Orchestration (Airflow, Dagster), Data Warehouses (Snowflake, BigQuery). |
| Analytics Engineer | Transforming and modeling raw data into clean, trusted, business-ready datasets within the warehouse. | Advanced SQL, dbt, Git, Data Warehousing Concepts, Business Intelligence (BI) Tools (Tableau, Power BI). |
| Business Analyst | Translating business needs into technical requirements and validating data outputs. | SQL, BI Tools, Strong Communication Skills, Domain Expertise. |
| Project Manager | Overseeing the project timeline, budget, resources, and stakeholder communication. | Agile/Scrum Methodologies, Project Management Software (Jira, Asana), Communication, Risk Management. |
Having these roles clearly defined ensures that everyone knows their part, from initial strategy to final analysis, preventing gaps and overlaps in responsibility.
Vetting and Selecting the Right Partner
Most companies building their first data warehouse don’t have all this specialized expertise in-house. Bringing in a data engineering consultancy can be a game-changer, helping you get up and running faster while sidestepping common mistakes.
But not all partners are created equal.
When evaluating firms, you must look past the sales presentations and dig for real proof of their expertise.
The best indicator of a consultancy’s capability isn’t their marketing material; it’s the depth of their technical case studies and the seniority of the team they propose for your project. A great partner will focus on your business outcomes, not just their toolset.
Your Request for Proposal (RFP) needs to be sharp and demand specifics.
- Ask for detailed case studies relevant to your industry and the tech you’re considering (e.g., show me what you’ve done with Snowflake and dbt for another e-commerce company).
- Request resumes of the actual team members who will be assigned to your project. Don’t settle for a generic list of their top architects.
- Drill down on their project management methodology. How do they run projects? Do they use an agile approach with frequent demos to get your feedback early and often?
A huge red flag is a “one-size-fits-all” pitch. If a potential partner is proposing a solution before they’ve asked tough questions about your business goals and current data chaos, they’re just selling a pre-packaged template.
A Realistic Project Timeline
One of your biggest jobs is managing expectations, especially with senior leadership. A phased timeline is the best tool for this. While every project is unique, a typical implementation follows a predictable rhythm.
Here’s a sample timeline to give you a feel for the flow:
-
Discovery & Design (Weeks 1-4): This is all about planning. You’ll be in workshops with stakeholders to nail down business requirements, audit your source systems, and sketch out the high-level architecture and data model. The main output here is a detailed project roadmap.
-
Foundation & Pipeline Development (Weeks 5-12): Now the engineering work begins. The team will set up the cloud data warehouse, start building ingestion pipelines for 2-3 of your most critical data sources, and implement the core data models.
-
BI Integration & User Acceptance Testing (UAT) (Weeks 13-16): With the first batch of data flowing and modeled, it’s time to connect a BI tool and build a pilot dashboard. A small, hand-picked group of business users gets to test the data and reports to provide that all-important feedback loop.
-
Rollout & Training (Weeks 17-18): After tweaking things based on UAT feedback, you roll out the first version of the warehouse to a wider group. This phase is less about code and more about people—heavy on user training and documentation to ensure project adoption.
Common Questions We Hear About Building a Data Warehouse
Even the best-laid plans run into questions. When you’re building a new data warehouse, certain queries pop up time and time again from both leadership and the team doing the work. Let’s get ahead of them.
Answering these common questions upfront can save headaches and keep the project moving.
How Long Is This Really Going to Take?
This is always the first question, and the honest answer is, “it depends.” But that’s not helpful, so let’s put some real-world timelines on it.
A tightly scoped project, perhaps for a single business unit with a handful of clean, well-understood data sources, can often go live in 3-6 months. Think of this as your “starter” warehouse.
On the other hand, a full-blown enterprise data warehouse that needs to connect dozens of disparate, messy systems is a different beast entirely. You should budget for 12-18 months, and sometimes longer. While modern ELT tools have made the “E” and “L” parts faster, the hard work of gathering requirements, modeling data correctly, rigorous testing, and getting people to actually use the thing still takes time. There are no shortcuts for that.
What Are the Biggest Hidden Costs?
It’s rarely the software sticker price that gets you. The two budget items that consistently catch people off guard are runaway compute usage and the cost of specialized talent.
- Compute Costs: With pay-as-you-go platforms, a few poorly written queries or an inefficient data pipeline can burn through your budget faster than you can say “SELECT *”. A single bad query from an analyst can cost a company hundreds of dollars in a few minutes. This is why active monitoring and query optimization aren’t just best practices; they’re essential for cost control.
- People Costs: The market for top-tier data architects, data engineers, and analytics engineers is incredibly tight. Finding, hiring, and keeping these experts is a significant, ongoing investment. Underestimating the people-cost is one of the most common and costly mistakes a company can make.
The biggest budget surprise in a data warehouse project is almost never the software license. It’s the unmonitored compute bill from inefficient queries and the recurring cost of the expert team you need to run the whole show.
Should We Build or Buy Our Data Pipelines?
This used to be a real debate, but for most standard data sources, the argument is over.
If you’re pulling data from common platforms like Salesforce, Google Analytics, or a standard Postgres database, buying is almost always the right call. A managed ingestion service like Fivetran or Airbyte is a no-brainer.
These tools handle all the tedious work—maintaining fragile API connections, dealing with unexpected schema changes, and ensuring uptime. This lets your expensive data engineers focus on what really matters: building pipelines for your unique, proprietary systems or implementing the complex business logic that drives real value.
The only time you should consider building an ingestion pipeline from scratch is when a reliable, pre-built connector simply doesn’t exist.
Finding the right expertise is crucial for navigating the complexities of creating a data warehouse. At DataEngineeringCompanies.com, we provide independent, data-driven rankings of top data engineering firms to help you select the perfect partner with confidence. Explore our 2025 expert rankings and find your match today.
Top Data Engineering Partners
Vetted experts who can help you implement what you just read.
Related Analysis
A Practical Guide to the Modern Data Stack in 2025
Explore the modern data stack with this practical guide. Learn about its architecture, core layers, AI integration, and governance to drive real business value.
What Is Data Fabric? A Practical Guide to Modern Data Architecture
Confused about what is data fabric? This guide explains its architecture, compares it to data mesh, and shows how it solves today's complex data challenges.
How to Hire a Data Governance Consultant Who Delivers Real Business Value
Hiring a data governance consultant? Our guide provides actionable advice on crafting RFPs, evaluating partners, and avoiding common pitfalls. Find your expert.