The Top 12 Data Pipeline Monitoring Tools for Enterprise Teams
data pipeline monitoring tools, data observability, data quality, pipeline monitoring, ETL monitoring
Data pipeline monitoring tools catch what a broken dashboard won’t tell you until it’s too late: a schema change in an upstream API, a corrupted file that landed in S3 three days ago, a job that quietly stopped refreshing. Some tools watch pipeline runs and orchestration health; others watch the data itself, checking freshness, volume, schema, and row-level quality. Most mature data teams end up running one of each, not one instead of the other.
This guide reviews twelve tools worth shortlisting for a Snowflake, Databricks, BigQuery, or Airflow-based stack, each with a real technical trade-off, not just a feature list. The category earns its budget line because of what sits downstream: 68 of the 86 firms in the Data Engineering Companies Index list analytics and BI work among their core capabilities, and a stakeholder-facing dashboard is usually the first place a silent pipeline failure shows up.
What this guide covers:
- Core capabilities and what actually differentiates each platform from the others.
- Where each tool fits - orchestration-native, warehouse-native, agent-based, or dbt-native.
- Implementation notes, common pitfalls, and pricing signals from public sources.
- A comparison table and a selection framework for narrowing your shortlist before a demo.
1. Monte Carlo Data: Data Observability Platform
Monte Carlo is an end-to-end data observability platform, making it a strong contender among data pipeline monitoring tools for enterprises. Its core capability is its automated, low-configuration approach to anomaly detection. The platform monitors data warehouses, lakes, ETL processes, and BI tools to proactively identify and alert on issues like freshness, volume discrepancies, schema changes, and data quality rule failures without requiring extensive manual setup.
The platform’s primary differentiator is its deep, field-level data lineage. This allows data teams to perform rapid root-cause analysis when an issue is detected and conduct impact analysis to see which downstream dashboards or reports are affected. This feature matters for building trust in data assets and managing stakeholder communication during data incidents. The built-in incident management and triage workflows also streamline the resolution process directly within the platform.
Key Details & Evaluation Pointers
- Ideal Use Case: Organizations with complex, cloud-native data stacks (Snowflake, Databricks, BigQuery) that need broad, automated monitoring and deep lineage visibility to reduce “data downtime.” Its mature feature set is well-suited for established data teams.
- Implementation Note: Onboarding is relatively streamlined thanks to its wide range of native connectors. A key evaluation step is mapping critical data assets to its monitoring tiers to manage costs effectively. Understanding your modern data pipeline architecture examples will help you scope the implementation correctly.
- Pricing: Pricing is not public and is customized based on data volume, connector count, and feature tiers. Engagement with their sales team is required for a quote. It is also available via cloud marketplaces (like AWS), which can simplify procurement.
- Limitations: The premium pricing model may place it out of reach for smaller teams or early-stage companies. Organizations seeking a fully self-hosted solution will need to look at other options.
2. IBM Databand: Pipeline Observability
IBM Databand focuses specifically on pipeline-level observability, making it an excellent choice for teams whose primary pain point is the health and reliability of their data orchestration and ETL/ELT jobs. The platform provides deep visibility into job run-states, durations, and data SLAs, integrating directly with popular orchestrators like Airflow. Its strength is in catching operational issues, such as a job that runs too long or fails unexpectedly, and tying that failure back to its impact on specific datasets.
Databand’s operational focus and enterprise backing set it apart. While other tools focus more on warehouse-native data quality checks, Databand excels at monitoring the processes that move and transform the data. It provides live process views and executive dashboards that give a clear, high-level overview of pipeline health, which matters for operational teams managing complex workflows and strict delivery timelines. This process-centric approach makes it a valuable data pipeline monitoring tool for ensuring operational integrity.
Key Details & Evaluation Pointers
- Ideal Use Case: Data engineering teams heavily reliant on orchestrators like Airflow who need to improve the reliability and performance of their data pipelines. It’s a strong fit for organizations that value enterprise-level support.
- Implementation Note: Onboarding involves integrating Databand’s SDK with your data orchestrator. The key to a successful evaluation is to instrument a few critical or problematic pipelines first to see the immediate value in run-time alerting and historical performance analysis.
- Pricing: Databand offers publicly listed pricing tiers for entry-level usage, which is an advantage for teams needing to budget without an extended sales cycle. Pricing is based on usage and feature sets, with higher tiers for large-scale deployments.
- Limitations: While it monitors dataset freshness and schema, its data quality capabilities are less extensive than platforms focused purely on data-at-rest observability. Teams needing deep, automated, field-level anomaly detection within the warehouse may need to supplement it with another tool.
3. Acceldata: Data Observability Cloud (ADOC)
Acceldata’s Data Observability Cloud (ADOC) offers a broad, multi-layered approach to data monitoring that extends beyond typical data quality checks into platform reliability and cost governance. It is designed to provide visibility across the entire data lifecycle, covering data-in-motion and data-at-rest. The platform offers core data quality features like freshness checks and anomaly detection, but its unique value is the integration of these signals with operational performance and spend metrics from underlying data platforms.
This holistic view makes Acceldata a strong candidate for organizations looking to correlate data reliability issues with infrastructure performance or budget overruns. For example, a team can investigate if a sudden drop in data quality is linked to a poorly optimized query that is also driving up compute costs. Enterprise tiers further enhance its capabilities with advanced features like data reconciliation, which validates data consistency between source and target systems, a critical function for financial services and compliance-heavy industries.
Key Details & Evaluation Pointers
- Ideal Use Case: Organizations that need to manage not only the quality of their data pipelines but also the operational health and cost-efficiency of their data platforms (like Databricks, Snowflake, and on-prem Hadoop). It’s a fit for teams where platform administration and data engineering responsibilities are closely linked.
- Implementation Note: Given its broad scope, a phased implementation is recommended. Start by connecting it to a critical data platform to monitor data quality and platform signals, then expand to cost governance. The availability of a free trial and marketplace procurement can accelerate evaluation.
- Pricing: Pricing is customized and requires direct engagement for a quote. Acceldata is available via cloud marketplaces like AWS, which can simplify billing and procurement. Note that marketplace listings often show illustrative pricing, so a formal quote is necessary for accurate budgeting.
- Limitations: The platform’s extensive feature set can present a steeper learning curve compared to more narrowly focused tools. Smaller teams may find the breadth of capabilities overwhelming if their primary need is just data quality monitoring.
4. Soda: Data Observability and Data Quality
Soda is a developer-friendly data observability platform that emphasizes embedding data quality checks directly into data pipelines using its open-source core and SodaCL (Soda Checks Language). This “shift-left” approach allows teams to treat data quality as code. The platform is designed for fast onboarding, allowing users to quickly configure monitors and gain visibility through automated anomaly detection and metric monitoring.
What sets Soda apart is its blend of a no-code setup for business users and a checks-as-code experience for technical teams. This duality makes it an adaptable choice for organizations at different stages of data maturity. Its proprietary algorithms for metrics observability, combined with features like historical data backfilling and record-level detection, provide explainable and actionable alerts. Direct integrations with data catalogs and incident management tools like Opsgenie or PagerDuty route quality issues to the right team without extra glue code.
Key Details & Evaluation Pointers
- Ideal Use Case: Teams looking for a fast-to-implement data quality solution that can scale from a single project to an organization-wide program. Its checks-as-code philosophy is particularly well-suited for engineering-led data teams that want to integrate monitoring into their CI/CD processes.
- Implementation Note: Start with the free tier to connect up to three datasets. This is a practical way to evaluate SodaCL and the platform’s core alerting capabilities on a non-critical data pipeline before committing to a broader rollout. The no-code interface is a fast way to get initial monitors running.
- Pricing: Soda offers a transparent pricing model, including a free tier for small-scale use. Paid plans are typically priced on a per-dataset basis, which can be cost-effective for targeted monitoring but may become expensive for organizations wanting to monitor a vast number of data assets.
- Limitations: The per-dataset pricing model, while transparent, can be a potential cost-scaling issue for enterprises with thousands of tables to monitor. Organizations requiring deep, column-level lineage across the entire data stack may find its capabilities less extensive than more enterprise-focused platforms.
5. Bigeye: Enterprise Data Observability
Bigeye is a data and AI trust platform with a strong emphasis on observability driven by data lineage. It’s a powerful option among data pipeline monitoring tools for organizations managing large or intricate data stacks. The platform provides automated monitoring coverage for core metrics like volume, freshness, and schema, using anomaly detection to catch issues before they impact downstream consumers.
The platform’s standout feature is its lineage-aware root-cause analysis, which helps teams quickly pinpoint the source of a data quality failure. Another key differentiator is its support for monitoring-as-code through “Bigconfig,” allowing data teams to define and manage monitoring rules via YAML and a CLI. This approach enables version control, programmatic updates, and direct integration into existing CI/CD workflows, a useful feature for mature engineering teams.
Key Details & Evaluation Pointers
- Ideal Use Case: Large enterprises or scale-ups with complex data environments that prioritize a programmatic, code-based approach to data quality monitoring. It’s particularly well-suited for teams wanting to integrate observability into their DevOps practices.
- Implementation Note: To get the most out of Bigeye, teams should be prepared to adopt its monitoring-as-code philosophy. This may require an initial setup investment but pays off in scalability and governance. Properly mapping its capabilities aligns well with strong data governance best practices.
- Pricing: Bigeye does not list pricing publicly. A customized quote is provided after a demo and consultation to understand the scale of your deployment.
- Limitations: The platform’s code-centric approach might present a steeper learning curve for less technical business users or teams accustomed to purely UI-driven tools. Its enterprise focus means it may be overkill for smaller organizations with simpler needs.
6. Kensu: Real-time, Lineage-aware Data Observability
Kensu offers a distinct, agent-based approach to data observability that focuses on prevention. Instead of only monitoring data at rest in a warehouse, its agents are embedded directly within data-producing and consuming applications. This allows Kensu to collect detailed, real-time metrics and lineage information at the point of use, catching data quality issues before they propagate downstream and impact business intelligence reports or machine learning models.
The platform’s core strength is its “Data Observability at the Source” methodology. By understanding how data is being created and used in real-time, its anomaly detection can provide immediate context for root-cause analysis. This deep, lineage-aware context is valuable in highly regulated industries like finance or healthcare, where proving data integrity and tracing provenance is a compliance requirement. This makes Kensu a compelling option among data pipeline monitoring tools for organizations prioritizing proactive issue resolution.
Key Details & Evaluation Pointers
- Ideal Use Case: Organizations in regulated industries or those with mission-critical applications that cannot tolerate data quality failures. It is best suited for teams that want to prevent bad data from entering their systems rather than just cleaning it up afterward.
- Implementation Note: The agent-based deployment requires instrumentation within your application runtimes (e.g., Spark, Kafka, Python scripts). This is a more involved setup than connector-based tools, so evaluating the integration effort with your specific tech stack is a necessary first step.
- Pricing: Kensu does not publish its pricing. A custom quote must be obtained by engaging with their sales team and is typically based on the number of agents, data volume, and required features.
- Limitations: The need to deploy agents can introduce additional complexity and a potential performance overhead compared to agentless solutions. This approach may be a barrier for teams looking for a simple, non-intrusive monitoring setup.
7. GX Cloud (Great Expectations Cloud): Test-Driven Data Quality and Monitoring
GX Cloud builds upon the widely adopted open-source framework, Great Expectations, offering a managed, collaborative environment for defining and validating data quality. Its core strength is a “test-driven” approach where teams codify data expectations as version-controlled test suites. This makes it a powerful tool for enforcing data contracts and ensuring data adheres to specific, known business rules as it moves through pipelines.
The platform centralizes the management of these expectations, validation results, and alerting. It integrates directly into existing CI/CD workflows and orchestration tools like Airflow or dbt, letting developers embed data quality checks straight into their data transformation and loading processes. By treating data quality as code, GX Cloud lets data teams build more reliable, predictable pipelines and catch issues before they hit downstream consumers.
Key Details & Evaluation Pointers
- Ideal Use Case: Developer-centric data teams that want to embed explicit, code-based data quality tests directly into their pipelines. It is excellent for organizations standardizing on a “data contracts” framework and building on tools like dbt.
- Implementation Note: Getting started is straightforward, especially for those familiar with the open-source version. The key is to strategically identify critical validation points in your pipeline and build out reusable “Expectation Suites” that can be applied to multiple datasets.
- Pricing: GX Cloud offers a free developer tier for individuals and small projects. Paid Team and Enterprise tiers are available with more advanced features for collaboration, security, and support, requiring contact with their sales team for a quote.
- Limitations: This is not a turnkey observability platform; it excels at validating known conditions rather than automatically discovering unknown data issues. Teams seeking broad, automated anomaly detection for freshness or volume may need to supplement it with other data pipeline monitoring tools.
8. Prefect Cloud: Orchestration with Built-in Monitoring
Prefect Cloud is a workflow orchestration platform that approaches monitoring from the perspective of pipeline execution and health. Its strength lies in providing deep visibility into the state of data flows themselves. It offers a full-featured UI with dashboards that track flow and task runs, logs, retries, and adherence to service-level agreements (SLAs), making it a strong tool for the operational integrity of your data stack.
The platform is code-first and flexible, working with nearly any programming language or data stack while allowing your data to remain within your own VPC. Its built-in alerting and notification system ensures that teams are immediately aware of failures, crashes, or late runs. This makes Prefect a strong choice for teams who want to unify workflow orchestration and core operational monitoring into a single system before adding more specialized data quality tools.
Key Details & Evaluation Pointers
- Ideal Use Case: Engineering-centric teams that need a powerful, code-based orchestration tool with integrated operational monitoring. It excels in environments where the primary concern is the success, failure, and performance of the pipeline code itself.
- Implementation Note: Adoption is fast due to its Python-native feel and minimal infrastructure requirements. The key is to instrument your existing code with Prefect’s decorators. A major benefit is its hybrid model, where the control plane is managed, but execution and data stay in your environment.
- Pricing: Prefect offers a generous free Hobby tier for individuals or small projects. Paid plans are seat-based, offering predictable costs that scale with team size rather than data volume. Optional serverless compute credits are also available.
- Limitations: While it excels at operational monitoring, it is not a data observability tool. Deep column-level lineage, data quality validation, and anomaly detection require integration with other dedicated data pipeline monitoring tools.
9. Dagster Cloud: Asset-based Orchestration and Observability
Dagster Cloud tightly couples orchestration with observability. Its core philosophy revolves around “data assets” (like a table, a file, or a machine learning model), which provides an intuitive way to monitor data health. Instead of just monitoring pipeline runs, Dagster tracks the status and history of each asset, offering built-in lineage, run metadata, and log capture directly within the orchestration environment.
This asset-first model is particularly effective for organizations that are treating their data outputs as products. The platform’s visual asset graph makes it easy to understand dependencies and trace issues back to their source. Built-in sensors and alerting mechanisms allow teams to define health checks and receive notifications on materialization events, making it a developer-centric solution that combines pipeline execution with deep, contextual monitoring.
Key Details & Evaluation Pointers
- Ideal Use Case: Developer-heavy data teams looking for an integrated tool that handles both orchestration and observability. It is particularly well-suited for organizations adopting a data-as-a-product strategy, where the health and lineage of individual assets matter most.
- Implementation Note: Dagster’s power comes from defining your pipelines in code as a graph of assets. The learning curve involves adopting this specific programming model. A good evaluation step is to refactor a small, existing pipeline to see how its monitoring capabilities simplify troubleshooting. It’s a leading choice for teams evaluating modern data orchestration platforms.
- Pricing: Dagster Cloud offers transparent, usage-based pricing with a free tier for individuals and clear entry points for teams, including a 30-day free trial. Enterprise features require contacting sales for a custom plan.
- Limitations: While it offers strong observability, it’s not a standalone, agent-based monitoring tool; it primarily monitors pipelines defined and run within its own ecosystem. Teams seeking to monitor disparate systems without re-architecting them into Dagster may need a different solution.
10. Astronomer (Astro): Managed Apache Airflow with Monitoring
Astronomer provides a fully managed, enterprise-grade platform for Apache Airflow. Rather than offering a broad, agnostic observability layer, Astro focuses on the operational health and monitoring of Airflow DAGs (Directed Acyclic Graphs). It provides built-in alerting, high availability, audit logging, and deep performance insights specific to Airflow environments, making it one of the more relevant data pipeline monitoring tools for Airflow-centric teams.
The platform’s key differentiator is its deep expertise and contribution to the open-source Airflow project, which translates into deep support and a feature set that addresses common operational pain points. For teams running complex orchestration, Astro simplifies deployment, scaling, and troubleshooting. It effectively abstracts away the infrastructure management complexities of running production Airflow, allowing data engineers to focus on building reliable pipelines rather than maintaining the orchestrator itself.
Key Details & Evaluation Pointers
- Ideal Use Case: Organizations that have standardized on Apache Airflow for data pipeline orchestration and require a production-grade, managed service with enterprise support, security features like SSO, and guaranteed uptime SLAs.
- Implementation Note: The transition from self-hosted Airflow to Astro is well-documented. A key evaluation step is analyzing your current resource consumption (CPU, memory) to select the right deployment size, as this directly impacts cost. The platform is available on all major cloud marketplaces (AWS, GCP, Azure), simplifying procurement.
- Pricing: Astronomer offers transparent, usage-based pricing. Costs are calculated per hour based on the size and number of Airflow deployments and worker nodes you run. This component-based model provides predictability but requires careful resource planning.
- Limitations: Its primary focus is Airflow. While it can orchestrate tasks across various tools, the monitoring and observability features are centered on Airflow’s health, not the data quality within the pipelines themselves. It must be paired with other tools for end-to-end data observability.
11. Elementary Data: dbt-Native Data Observability (OSS + Cloud)
Elementary is a data observability tool built specifically for the dbt (data build tool) ecosystem. It offers both an open-source package and a managed cloud platform, providing a clear adoption path for teams of all sizes. Its core value is integrating deeply with dbt projects, allowing data teams to define data quality tests, freshness checks, and volume monitors directly within their existing dbt workflows, embracing an “observability-as-code” philosophy.
The platform excels at generating detailed, column-level lineage and exposure reports directly from your dbt project artifacts. This tight integration means that when a model fails or data quality issues are detected, engineers can immediately see the upstream causes and downstream impacts without leaving their core development environment. The cloud version extends these capabilities with features like AI-assisted triage and SOC 2 Type II compliance, making it a compelling upgrade path for organizations scaling their dbt usage.
Key Details & Evaluation Pointers
- Ideal Use Case: Data teams whose transformation layer is standardized on dbt. It’s a good fit for organizations wanting to embed monitoring directly into their data transformation code and for those who prefer starting with an open-source solution before committing to a commercial platform.
- Implementation Note: Getting started with the open-source version is straightforward for anyone familiar with dbt, requiring just a
pip installand some configuration in yourdbt_project.yml. Evaluating the cloud platform involves connecting your Git repository and data warehouse, with the key benefit being zero-maintenance infrastructure. - Pricing: The open-source package is free. The cloud version offers several tiers with pricing available upon request. A key commercial advantage is that plans are based on user seats and features rather than table count, which can be cost-effective for large projects.
- Limitations: Its primary strength is also its main limitation. Organizations with heterogeneous data stacks or significant non-dbt transformation pipelines will find it less comprehensive than broader data observability platforms.
12. AWS Marketplace: Buy/Subscribe to Data Observability Tools
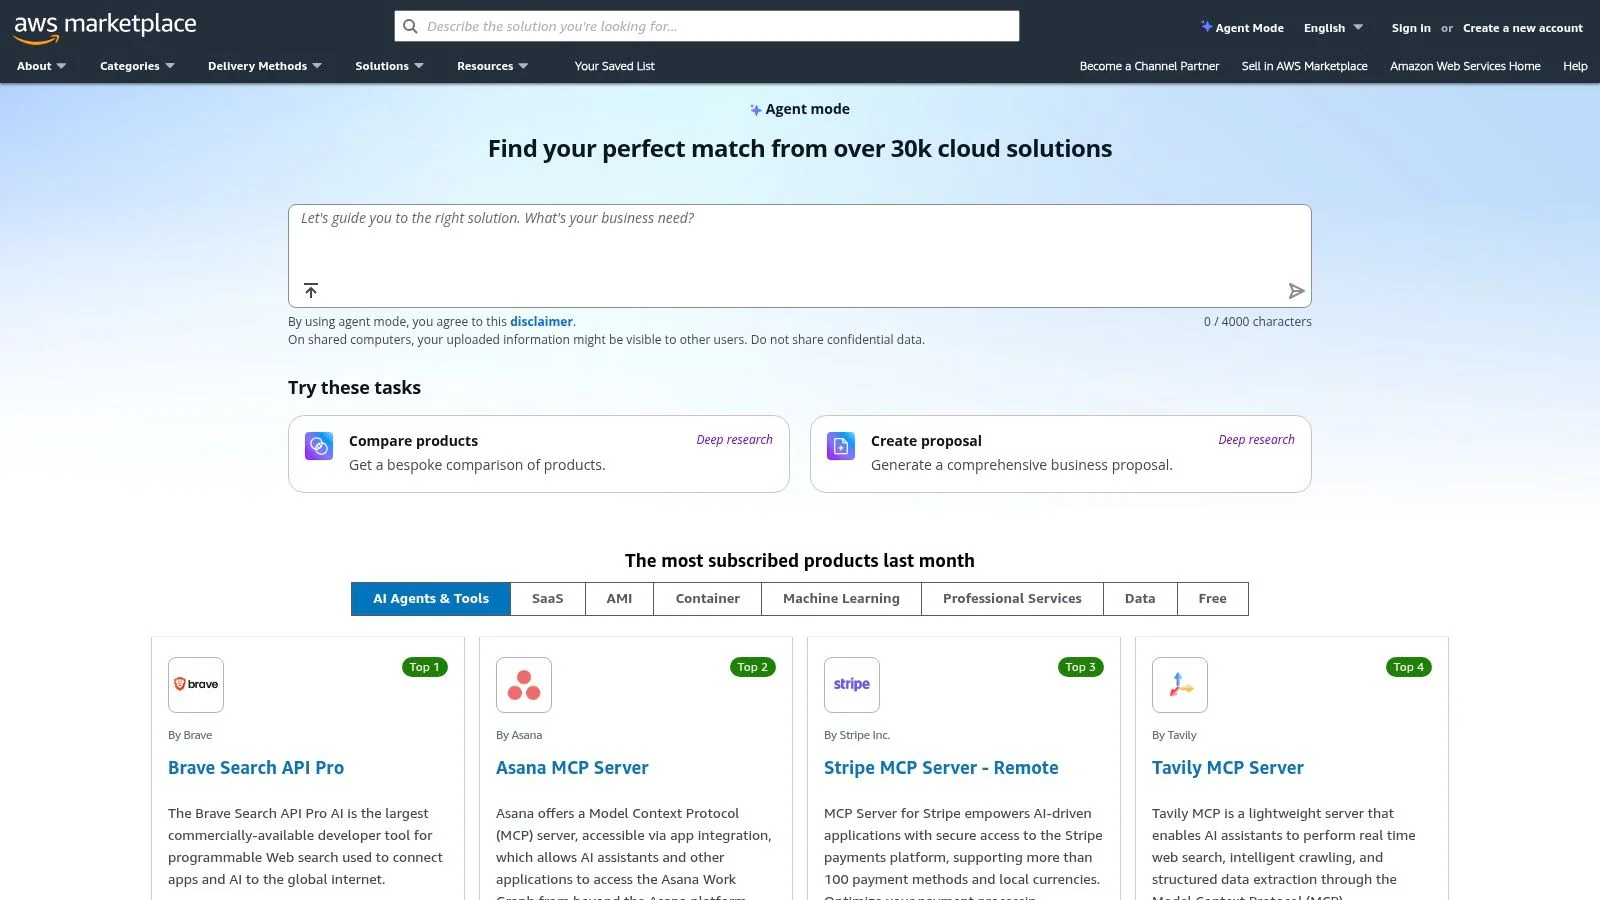
While not a monitoring tool itself, AWS Marketplace is a strategic platform for procuring and managing data pipeline monitoring tools. It functions as a digital catalog where organizations can find, buy, and deploy software from third-party vendors directly within their AWS environment. This significantly streamlines the often-cumbersome procurement process for enterprise tools, allowing teams to use existing AWS agreements and billing structures.
The primary advantage of using AWS Marketplace is the financial and administrative efficiency it offers. It allows companies to put their committed AWS spend (EDP) toward software purchases, which is a major benefit for budget management. The platform simplifies vendor onboarding and consolidates billing into a single AWS invoice, reducing administrative overhead. This makes it a useful resource for teams looking to accelerate the adoption of data observability solutions like Monte Carlo or Acceldata without getting bogged down in lengthy procurement cycles.
Key Details & Evaluation Pointers
- Ideal Use Case: Enterprises with existing AWS Enterprise Discount Program (EDP) commitments looking to simplify procurement and consolidate vendor billing. It’s also ideal for teams wanting to quickly trial and deploy pre-vetted data pipeline monitoring tools.
- Implementation Note: When evaluating a tool, check its availability and pricing model on the Marketplace. Use the “Private Offers” feature to negotiate custom pricing and terms directly with the vendor, which can lead to better rates than standard public listings.
- Pricing: Varies by vendor. The Marketplace supports diverse models, including pay-as-you-go, annual subscriptions, and custom contracts. Pricing is often integrated directly into your monthly AWS bill.
- Limitations: Not every data observability vendor is available, and some may offer limited SKUs or deployment options compared to direct sales channels. Some listings still require manual sales engagement for a final quote, slightly diminishing the “click-to-deploy” convenience.
Data Pipeline Monitoring: 12-Tool Comparison
| Product | Core features | UX / Quality | Best for (Target audience) | Unique selling points | Pricing / Procurement |
|---|---|---|---|---|---|
| Monte Carlo Data: Data Observability Platform | End-to-end observability; anomaly detection; field-level lineage; incident workflows | Mature incident triage; deep lineage; broad connector coverage | Enterprises needing broad stack coverage and deep lineage | Field-level lineage; mature incident management; available via cloud marketplaces | Public pricing limited; sizing usually via sales; marketplace buying available |
| IBM Databand: Pipeline Observability | Pipeline run-state, duration & SLA alerts; dataset freshness/schema monitors; dashboards | Transparent entry pricing; enterprise-grade support and security options | Large enterprises seeking vendor backing and predictable entry costs | Published entry tiers; IBM global support and integrations | Published entry pricing for base tiers; higher tiers increase cost |
| Acceldata: Data Observability Cloud (ADOC) | Freshness, schema drift, anomaly detection; pipeline reconciliation; cost governance | Broad platform signals; enterprise controls; free trial available | Teams needing data quality + platform reliability and cost governance | Platform-level signals across infra and data; AWS Marketplace listings | Pricing by quote; marketplace may show illustrative contracts |
| Soda: Data Observability and Data Quality | Metrics observability; record-level detection; backfilling; data contracts | Fast onboarding; no-code monitors; free tier for small use | Teams wanting a lightweight, fast-to-start data quality solution | Free tier; explainable anomalies; low-cost Team plan | Free tier (up to 3 datasets); per-dataset pricing can scale with assets |
| Bigeye: Enterprise Data Observability | Volume, freshness, schema monitoring; lineage-aware RCA; monitoring-as-code | Designed for large/complex stacks; enterprise integrations | Organizations with complex data stacks needing codified monitoring | Monitoring-as-code (Bigconfig); deep lineage-enabled RCA | No public pricing; demo / sales engagement required |
| Kensu: Real-time, Lineage-aware Data Observability | Agent-based in-app metrics; real-time anomaly detection; impact analysis | Prevention-focused; close-to-consumer telemetry | Regulated environments needing prevention and detailed lineage | Agent-based real-time monitoring; prevention-first approach | Pricing not public; may require runtime agents and sales engagement |
| GX Cloud (Great Expectations Cloud): Test-Driven Data Quality | Managed expectation suites; validation runs; dataset alerting | Developer-friendly; open standard; free developer tier | Dev teams adopting test-driven data quality and standards | Popular open standard; strong community; dbt/Airflow friendly | Free developer tier; Team and Enterprise paid tiers available |
| Prefect Cloud: Orchestration with Built-in Monitoring | Flow/run dashboards; alerts, retries, SLAs; RBAC | Orchestration-first monitoring; predictable seat-based UX; free Hobby tier | Teams prioritizing orchestration with integrated monitoring | Seat-based predictable billing; VPC-friendly deployments | Seat-based pricing; free Hobby tier; optional serverless credits |
| Dagster Cloud: Asset-based Orchestration & Observability | Asset graph & lineage; materialization history; logs & sensors | Strong developer UX; asset-first model; trial periods | Developer teams building data products and asset-centric pipelines | Asset-first lineage and observability; clear small-team entry prices | Clear entry prices for solo/small teams; enterprise via sales |
| Astronomer (Astro): Managed Apache Airflow with Monitoring | Managed Airflow; alerting, SSO, audit logs, HA; deployment pricing | Production-grade Airflow; enterprise SLAs and support | Teams running Airflow in production wanting managed service | Deep Airflow expertise; transparent component pricing; marketplace buy | Usage-based deployment pricing (per-hour by size); marketplace options |
| Elementary Data: dbt-Native Data Observability (OSS + Cloud) | dbt-native monitors; column-level lineage; performance monitoring; AI triage | OSS path to start; cloud plans emphasize observability-as-code | dbt-centric projects and analytics engineering teams | dbt-native focus; OSS + cloud offering; unlimited tables in cloud plans | OSS free option; cloud tiers require contacting sales for pricing |
| AWS Marketplace: Buy/Subscribe to Data Observability Tools | Centralized procurement; private offers; consolidated AWS billing | Speeds procurement; simplifies vendor management | Buyers seeking consolidated billing and faster procurement | Consolidated AWS billing; private offers and contract templates | Pricing varies by vendor; some listings require seller engagement |
How do you choose the right data pipeline monitoring tool for your stack?
Match the tool to where your failures actually happen, not to a feature checklist. Comprehensive platforms like Monte Carlo and Acceldata cover the most ground - warehouse, lake, and BI layer together. Focused tools like Elementary or GX Cloud go deeper into one layer, usually dbt or CI/CD, and orchestrators like Prefect and Dagster monitor pipeline execution rather than data quality itself.
That split is the real distinction in this list: some tools watch the pipeline run, others watch what the pipeline produces, and a couple - Monte Carlo, Acceldata - try to do both. Treat “monitoring” as several disciplines (freshness, volume, schema, lineage, execution health) instead of one checkbox, and pick tools that cover the disciplines you’re actually missing today, not the ones a demo makes sound most impressive.
Reactive troubleshooting, waiting for a stakeholder to flag a broken dashboard, is the default failure mode without monitoring in place. The alternative is embedding checks directly into pipeline and orchestration code so problems surface before they reach a report or a model. Which tool gets you there depends on your architecture and your team’s maturity as much as any single feature list.
A practical framework for narrowing the list
Selecting a data pipeline monitoring tool is less about finding the “best” product and more about matching the tool to your problem, your stack, and your budget:
1. Define your core problem.
- Is it data quality? If your primary pain point is silent data errors corrupting BI reports, tools like Soda, Bigeye, or GX Cloud, with their deep focus on data quality checks and validation, should be at the top of your list.
- Is it pipeline reliability? If your data engineers spend most of their time debugging failed DAGs and SLA breaches, you need strong operational visibility. Look at orchestration-native solutions like Dagster, managed services like Astronomer, or a dedicated pipeline observability tool like IBM Databand.
- Is it data discovery and trust? For large enterprises where a “data swamp” is a real concern, comprehensive data observability platforms like Monte Carlo or Acceldata provide the lineage and automated monitoring needed to build trust and understand data asset dependencies.
2. Align with your stack’s center of gravity.
- Snowflake/Databricks centric: Your evaluation should heavily favor tools with deep, native integrations and optimized performance for these platforms.
- dbt-native: If dbt is the heart of your transformation layer, a tool like Elementary offers tight integration and a developer-centric workflow that will resonate with your analytics engineers.
- Open-source and self-hosted: For teams requiring maximum control, building on open-source foundations (like Great Expectations or Soda Core) might be the most strategic, if resource-intensive, path.
3. Evaluate total cost of ownership, not just licensing.
- Implementation overhead. How many engineering hours will deployment, configuration, and integration take? A cheaper tool with a high implementation burden can end up costing more than the “expensive” option.
- Maintenance and scaling. Does the tool scale automatically, or will it need dedicated headcount as data volume and pipeline complexity grow?
- Training and adoption. A tool your team won’t actually use doesn’t deliver value regardless of its feature list. Favor solutions with clear documentation that both engineers and business users can pick up quickly.
Your next step
Picking a monitoring tool is a real decision, but it doesn’t need to be a six-month evaluation. Start with a pilot on a single high-impact pipeline, ideally one that’s already caused a data incident, and score two or three candidates against it using the framework above. A working pilot gives you concrete numbers, setup time, false-positive rate, time-to-detection, that justify a broader rollout, and it beats another round of vendor demos.
A monitoring tool only closes half the gap. Setting up alerting rules, defining SLAs, and building the on-call process around them is implementation work, and it’s often where in-house teams run out of time. If you need help scoping or deploying one of these platforms, the Data Engineering Companies Index lists profiled firms by specialty, and data reliability engineering covers the operational practices that make a monitoring tool actually pay off.
- Part of our guide: Data Pipeline Architecture →

Researched & written by
Peter Korpak , Chief Analyst & Founder
Data-driven market researcher with 20+ years in market research and 10+ years helping software agencies and IT organizations make evidence-based decisions. Former market research analyst at Aviva Investors and Credit Suisse.
Previously: Aviva Investors · Credit Suisse · Brainhub · 100Signals
- Monte Carlo Services200 people · unverified
Implementing data observability and data reliability engineering
Listed, not reviewed
More in Data Pipeline Architecture
Data Reliability Engineering A Guide for CTOs
Learn what Data Reliability Engineering (DRE) is, why it matters, and how to implement it. A complete guide for leaders evaluating data engineering partners.
How to Build Data Pipelines That Last
Learn how to build data pipelines that are reliable, AI-ready, and efficient. A practical guide to modern data engineering strategies.
Top Data Engineering Managed Services for 2026
Compare leading data engineering managed services. Find models, pricing, & vendors. Use our RFP checklist to select your ideal Snowflake or Databricks partner.