Strategic Data Engineering ROI Measurement for CTOs
Data engineering ROI measurement has one real test: can you tell your CFO what you’re buying, when payback happens, and how you’ll know the consultancy caused the result rather than just showed up while it happened. If the honest answer is “better data foundations,” that’s a technical preference, not a business case.
For a multi-million dollar Snowflake, Databricks, dbt, or Airflow modernization, a credible ROI model has to do three jobs at once: justify the spend, govern delivery, and protect you during vendor selection. Skip the first and the project never gets funded. Skip the second and it drifts once it does. Skip the third and you’ll over-credit the consultancy for wins your own team drove, or under-manage the parts that were always yours to own.
What does your CFO actually want when they ask for ROI on data engineering?
Most CTOs answer this question backwards, leading with architecture when the CFO is asking about economics, risk, and timing. A real answer names what gets cheaper or faster, quantifies it, and states when the investment pays back.
A working answer sounds like: we’re investing to cut manual engineering effort, reduce downtime and data-trust failures, and speed up business decisions that are currently blocked by stale or unreliable pipelines. Then you quantify each one.
That’s the difference between a funded platform program and a “phase zero” that never scales.
Why standard IT ROI logic fails
Traditional infrastructure ROI models focus on hard cost takeout. That’s too narrow for data engineering. A migration from legacy ETL to modern cloud data pipelines on Snowflake, Databricks, BigQuery, or Azure isn’t just a hosting change. It changes transformation speed, reliability, governance, developer workflow, and how fast business teams can act on data.
Vendor-sponsored benchmarks are directionally useful even though they aren’t neutral. Nucleus Research’s analysis of ETL platform customers, published by Integrate.io, found three-year ROI well above 100% with payback inside a year, driven mainly by faster transformations and fewer manual error fixes (Integrate.io ETL ROI benchmarks). Treat that as a vendor-sponsored best case, not a baseline for your own project.
Practical rule: if your business case doesn’t show baseline pain, target metrics, owners, and a payback path, finance will treat it as discretionary spend.
Build the business case before the architecture deck
Before you debate Databricks versus Snowflake, or dbt versus in-platform SQL, put the economics into a structure your executive peers can review. A clean format like WeekBlast’s business case template helps because it forces explicit assumptions, options, costs, risks, and ownership.
Use it to answer five questions:
- What is broken now: Manual rework, slow transformations, unreliable pipelines, weak lineage, duplicated metrics.
- What changes in the target state: Automated orchestration, testable transformations, clearer ownership, lower latency, stronger governance.
- Who benefits: Data engineering, analytics, finance, operations, and executive decision-makers.
- How value shows up: Labor savings, fewer incidents, faster decisions, reduced bad-data exposure, better AI/ML readiness.
- How you’ll prove it: A baseline and review cadence tied to named KPIs.
If you can’t explain ROI in those terms, don’t issue the RFP yet.
What are the three layers of data engineering ROI?
A credible ROI model has three layers: operational efficiency, strategic impact, and innovation and growth. Present only one, and the business case looks incomplete no matter how strong the underlying numbers are.
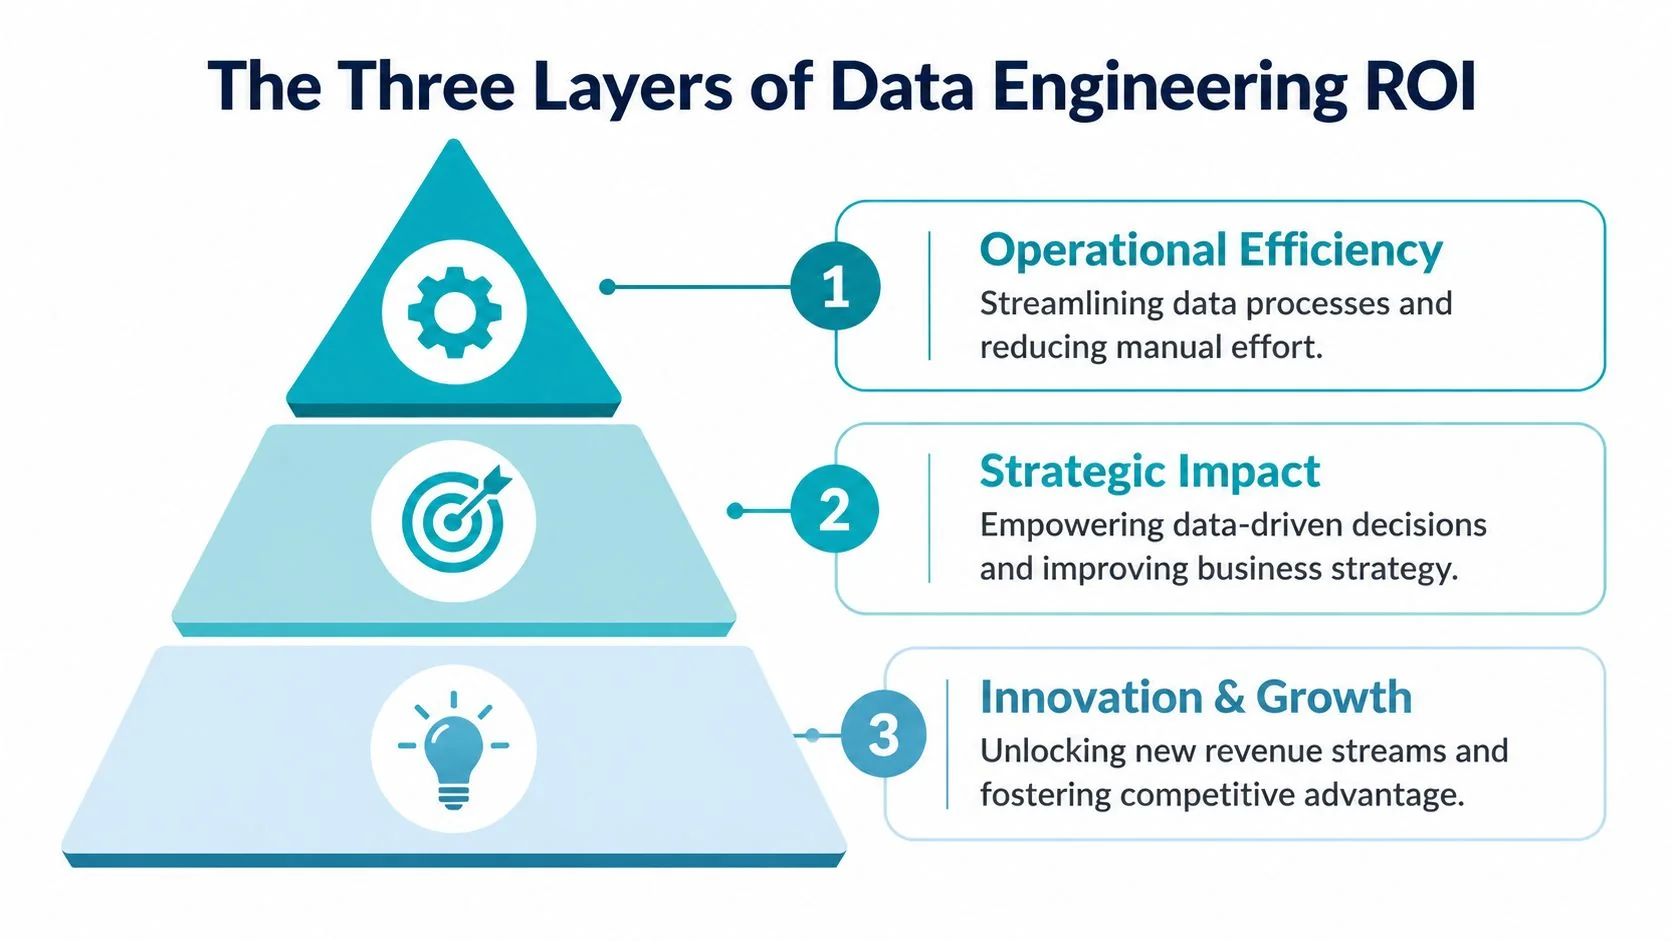
Operational efficiency
This is the floor. It covers the obvious gains from better pipeline architecture, orchestration, and transformation practices.
Think about what changes when a consultancy replaces brittle legacy ETL with well-structured dbt models, Airflow orchestration, and cloud-native storage and compute. Engineers spend less time patching jobs. Analysts wait less. Teams stop rebuilding the same logic in multiple places.
The clearest benchmark here comes from modern analytics engineering. A Forrester Consulting Total Economic Impact study commissioned by dbt Labs found 194% ROI with breakeven inside six months, tied to gains in developer productivity, data quality, and collaboration efficiency (dbt Labs analytics ROI research). It’s a commissioned study, so read the multiple as an upper bound, but the underlying mechanism, less time lost to rework and coordination, holds up on its own logic.
Operational efficiency is the easiest layer to model because it maps directly to labor and support effort. It’s also the weakest layer to lead with if you’re asking for a large modernization budget. Cost savings alone rarely justify a platform shift.
Strategic impact
At this point, the business case becomes credible.
Strategic impact sits between engineering output and executive value. It includes lower data latency, more reliable reporting, faster issue resolution, and greater confidence in planning, pricing, supply chain, or growth decisions. The point isn’t “our pipelines are better.” The point is that leaders stop making decisions on stale or suspect data.
A data platform earns executive support when it changes decision velocity, not when it merely improves architecture hygiene.
This layer is what connects platform work to planning cycles, operating cadence, and cross-functional trust. It’s also where governance belongs. Governance isn’t compliance theater. It’s what lets finance, operations, and product teams use the same numbers without relitigating definitions every week.
Innovation and growth
This is the top layer. Organizations frequently mention it too early and too vaguely.
Innovation and growth value appears when your platform supports new data products, AI/ML workloads, experimentation, and reusable data assets across teams. That’s the upside a CEO cares about, but it only becomes believable once the bottom two layers are already quantified.
A consultancy pitching “AI readiness” without a measurable plan for pipeline reliability, lineage, and transformation quality is selling aspiration. Don’t buy aspiration.
How to use the three-layer model in executive conversations
Use the layers to separate benefits by audience:
| Executive audience | ROI layer they care about most | What to show |
|---|---|---|
| CFO | Operational efficiency | Labor savings, reduced manual processing, payback timing |
| COO | Strategic impact | Better reliability, lower latency, fewer reporting disruptions |
| CEO or BU leader | Innovation and growth | Faster launch of analytics and AI-enabled use cases |
A consultancy should map its proposal to all three. If it only talks about engineering velocity, it’s underselling the work. If it only talks about transformation and AI, it’s hiding execution risk.
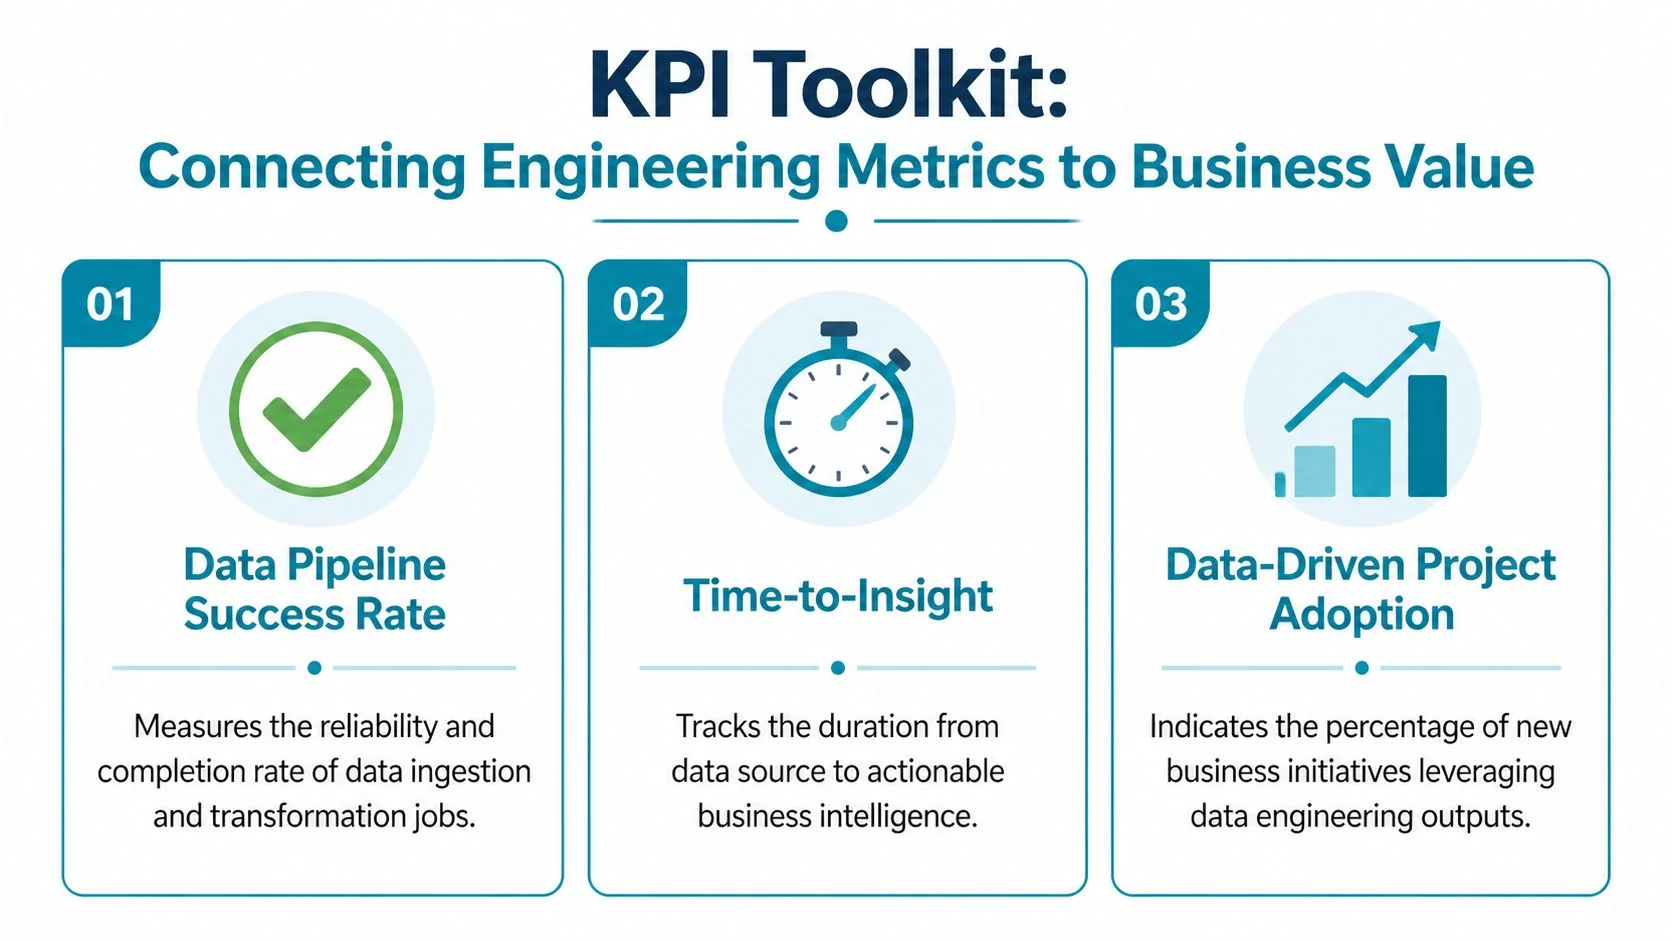
Which KPIs connect engineering work to business value?
The fastest way to ruin data engineering ROI measurement is to track only financial outputs. You need operating KPIs that move before the money shows up, or you’ll discover failure only after the budget is spent.
Efficiency KPIs that finance can understand
For platform modernization, start with a small set of operational KPIs and refuse to let the vendor bury them under vanity dashboards.
Track these before the engagement starts:
- Transformation cycle time: How long it takes to build, test, and release a production-ready transformation.
- Manual intervention load: How often engineers step in to rerun jobs, fix schemas, backfill data, or reconcile outputs.
- Support burden: The volume and type of data-related support work created by pipeline failures or broken definitions.
- Delivery throughput: The speed at which the team ships trusted data assets to downstream analytics users.
If you want a useful parallel for measuring the human side of engineering output, this piece on modern approaches to developer productivity is worth reading. The core lesson applies directly here: measure flow and friction, not just raw activity.
Latency is a business KPI, not a plumbing KPI
Most engineering teams understate the value of latency. They treat it as a technical improvement. It isn’t. It directly affects decision speed.
Cutting latency in half, from a daily batch to same-day availability, measurably speeds up the decisions that depend on it: campaign changes, fraud flags, inventory calls. The exact dollar value depends on what’s riding on the data, but the direction holds across most use cases we’ve reviewed: faster data means faster, cheaper decisions.
That gives you a practical way to position latency KPIs:
| KPI | Definition | Business translation |
|---|---|---|
| Data latency | Time from source event to analytical availability | Decision speed |
| SLA adherence | Whether critical datasets arrive on time | Planning reliability |
| Time-to-insight | Time from business question to trusted answer | Commercial responsiveness |
For a retail or fintech stack, that may mean campaign optimization or fraud analysis. For enterprise finance, it may mean faster variance analysis or more credible forecasting. The metric is technical. The value is operational.
Don’t report latency as “pipeline freshness.” Report it as the delay between an event and an executive action.
Reliability KPIs separate serious vendors from slideware
Operational execution determines whether Snowflake, Databricks, Airflow, Kafka, and dbt implementations succeed or fail. If pipelines break constantly, the rest of the ROI model is fiction.
Monitor:
- Pipeline success rate: Percentage of scheduled jobs completing without failure.
- Incident frequency: How often critical pipelines break in a reporting period.
- Time-to-recovery: How long it takes the team to restore service after a failure.
- Rework load: Engineering and analyst time spent fixing downstream consequences of upstream issues.
These KPIs matter because they expose whether the consultancy is building an operable platform or just delivering initial migration scope.
Governance and adoption KPIs prove the platform is being used
A technically elegant platform with poor adoption has weak returns.
Use governance and adoption measures such as:
- Certified data asset usage: Whether business teams consume governed models and dashboards.
- Metric consistency: Whether teams rely on standardized definitions instead of local spreadsheet logic.
- Lineage coverage: Whether critical datasets can be traced back to source and transformation logic.
- New use-case activation: How quickly a new reporting, analytics, or AI need can move onto the platform.
A sane KPI rule set
Keep the scorecard tight.
- Use a baseline: Measure before consultants touch the stack.
- Tie each KPI to an owner: Finance owns cost assumptions. Engineering owns reliability. Business teams validate adoption.
- Track leading and lagging indicators: Time-to-recovery and latency move before revenue or cost outcomes do.
- Review monthly, not only at the steering committee: ROI drift starts in operating metrics.
How do you build an ROI model finance will actually trust?
A workable model is simple enough for finance to audit and detailed enough for engineering to defend. Start with the standard ROI formula already used in ETL modernization analysis, (Net Benefits / Total Costs) x 100, then make the inputs rigorous.
Step one: baseline the current state
Capture the current operating reality before vendor selection, not after kickoff.
You need baseline values for effort, incidents, latency, support burden, and trust issues. Reliability matters here because poor reliability compounds quietly: frequent pipeline breakages force engineers into reactive firefighting instead of planned work, and every hour spent restoring a failed job is an hour not spent on the roadmap you funded the project for. Baseline your current break rate and mean time to recovery before the engagement starts, because those two numbers, more than any single dollar estimate, tell you whether reliability is actually improving.
Step two: convert engineering improvements into monetary value
Weak business cases usually fail here. They stop at “faster pipelines” instead of converting outcomes into money.
Use three buckets:
-
Efficiency benefits Translate lower manual effort and fewer support tickets into labor savings or capacity released for higher-value work.
-
Risk reduction benefits Quantify avoided downtime, avoided rework, and lower exposure to bad-data decisions.
-
Enablement benefits Value faster delivery of dashboards, models, and analytics use cases by tying them to documented business dependencies.
Operator advice: if a benefit can’t be tied to a baseline metric and an owner, exclude it from the core ROI case and keep it as upside.
Step three: price the full investment
Count all costs, not just consultancy fees.
Include platform licenses, cloud consumption, migration effort, internal engineering time, training, observability tooling, governance work, and post-go-live stabilization. If you ignore internal time, your model will look good and be wrong.
Consultancy fees vary widely: hourly rates across the 86 firms profiled in the Index run from $45 to $250, with a median around $100. A rate quote alone tells you little about total project cost without knowing the scope and hours behind it. For teams building reusable tracking into client programs, the discipline used to track client AI automation ROI is a useful reference point: define value events, assign ownership, and review actuals against the model from the start.
Step four: model year by year
Use a worksheet that finance and procurement can inspect.
| Metric | Formula / Source | Year 1 Value | Year 2 Value | Year 3 Value |
|---|---|---|---|---|
| Efficiency benefits | Baseline engineering and analyst effort reduced after modernization | |||
| Reliability benefits | Downtime and rework avoided based on incident reduction and faster recovery | |||
| Latency benefits | Value from faster decisions on critical workflows | |||
| Governance and trust benefits | Avoided reconciliation effort and reduced bad-data exposure | |||
| Total benefits | Sum of all benefit categories | |||
| Consultancy cost | SOW fees and retained support | |||
| Technology cost | Platform, tooling, and cloud spend | |||
| Internal cost | Staff time, change management, training | |||
| Total costs | Sum of all investment categories | |||
| Net benefits | Total benefits less total costs | |||
| ROI | (Net Benefits / Total Costs) x 100 |
Step five: force a payback discussion
Your CFO will ask two things after ROI: when do we break even, and what would cause us to miss?
Answer both in writing. Then tie the risk factors to delivery controls such as stage gates, KPI reviews, and acceptance criteria in the SOW.
How do you isolate what the consultancy actually delivered?
Clients over-credit the consultancy when a modernization works and over-blame it when one stalls. Both are lazy. Attribution has to be designed into the engagement, in the contract, before work starts.

Why attribution breaks down
In real programs, outcomes come from mixed inputs. The consultancy redesigns pipelines. Your internal team cleans up governance. A platform vendor changes pricing or features. Business teams improve adoption. Then everyone argues about who delivered the return.
Elder Research, a data science consultancy that has written about this pattern, points out that attribution problems are common wherever internal and external teams both touch the same pipeline: buyers tend to over-credit the vendor when a project succeeds and over-blame it when one stalls, and without a contract that separates the two, budgets get reallocated on weak evidence (Elder Research on data engineering pitfalls).
That should change how you write every SOW.
What to put in the contract
The stronger proposals define attribution up front, before the SOW is signed, rather than leaving it to be argued about at the steering committee.
Require these elements:
- Named KPI ownership: State which KPI the consultancy influences directly, which KPI your internal team owns, and which KPI is shared.
- Pilot-based attribution: Use a scoped migration, pipeline domain, or business unit as a controlled proof point before wider rollout.
- Pre and post baselines: Freeze the baseline period before implementation starts.
- Exclusion logic: Identify benefits that shouldn’t be credited to the vendor, such as parallel internal governance changes or business process redesign.
If attribution isn’t written into the contract, the vendor will still talk about ROI. You just won’t be able to verify whose ROI it is.
The simplest attribution model that works
Use a three-part split:
| Contribution area | Primary owner | How to evaluate |
|---|---|---|
| Platform implementation | Consultancy | Delivery against scope, reliability, latency, migration quality |
| Operating model and governance adoption | Internal team | Stewardship, process discipline, metric consistency |
| Business uptake | Shared | Adoption of outputs, use-case activation, stakeholder usage |
That model won’t make attribution perfect. It makes it governable. That’s enough.
What does negative ROI from data downtime actually look like?
Most ROI models are too optimistic because they count delivered features and ignore whether anyone trusts the data after go-live. A migration can hit scope, go live on time, and still destroy value if schema drift, broken lineage, or weak quality controls force teams back into manual validation.

That’s negative ROI in practice, even if the deck says the platform is “live.” Sound governance and access control, of the kind Databricks Unity Catalog or Snowflake’s role-based access model are built around, is part of what keeps that trust intact (Databricks Unity Catalog documentation, Snowflake access control overview).
Trust-adjusted ROI is the model most teams skip
A meaningful share of cloud platform modernizations show negative ROI in year one once you account for the cost of untrusted data, not because the migration failed technically, but because nobody trusted the output enough to retire the old manual checks. One way to model that is trust-adjusted ROI: (Value - (Investment + Downtime Cost)) / Investment (Domo’s overview of data analytics ROI).
That formula matters because it forces you to subtract the cost of instability and distrust, not just implementation spend.
Three trust killers show up constantly in consulting proposals:
- Weak observability: No serious plan for freshness, schema, volume, and lineage monitoring.
- Thin governance design: Ownership and certification get deferred until after migration.
- Success defined as cutover: The vendor treats data moved as value delivered.
For a deeper operating view, review this guide to data reliability engineering. Reliability isn’t an add-on. It’s the control layer that protects ROI after launch.
How to price downtime and trust gaps
Use a simple challenge test during procurement.
Ask every consultancy to show:
- how it will detect broken pipelines,
- how it will surface data quality regressions,
- who responds to incidents,
- how business users will know a dataset is trusted,
- what happens to KPI reporting when a critical dependency fails.
If the answer is vague, your ROI model is inflated.
A platform with low trust has two costs. The first is direct rework. The second is that business teams stop using it and rebuild workarounds outside your controls.
A short explainer is worth watching if your executive team still treats downtime as an IT uptime issue rather than a decision-quality issue.
Red flags that belong in every vendor review
Don’t approve a consultancy proposal if it lacks:
- A production observability plan
- Lineage and ownership definitions for critical data products
- Runbooks for incident response and recovery
- Post-go-live trust metrics
- A method for tracking negative ROI drivers alongside positive gains
If those items are missing, the model is incomplete and the spend is harder to defend.
How do you turn the ROI model into an RFP?
A good ROI model doesn’t sit in a finance deck. It becomes the backbone of the RFP, the SOW, and the steering committee.
Use this action plan before you engage a consultancy:
- Define the business case in three layers: Separate efficiency, strategic impact, and innovation benefits so each executive stakeholder sees the value relevant to them.
- Baseline the operating KPIs now: Capture latency, reliability, support burden, trust issues, and delivery speed before procurement begins.
- Embed attribution into the SOW: Require named KPI ownership, pilot-based proof points, and exclusion logic for benefits driven by internal work.
- Use trust-adjusted ROI, not headline ROI: Subtract downtime and trust failures from the value model.
- Make reliability part of vendor evaluation: Treat observability, lineage, incident response, and governance design as commercial requirements, not technical extras.
Pair the model with a structured RFP checklist so procurement isn’t reinventing the requirements list from scratch, and use this benchmark on data engineering consulting rates for 2026 to pressure-test whether a proposal’s economics line up with the expected return.
Your next move is straightforward: build the ROI model before you shortlist vendors, then make every consultancy respond to that model instead of to a generic migration brief. Use the Data Engineering Companies Index to compare firms, pressure-test capabilities, and tighten your shortlist before the RFP goes out.
Researched & written by
Data-driven market researcher with 20+ years in market research and 10+ years helping software agencies and IT organizations make evidence-based decisions. Former market research analyst at Aviva Investors and Credit Suisse.
Previously: Aviva Investors · Credit Suisse · Brainhub · 100Signals
Vetted partners
Top Enterprise Partners
Vetted firms whose specialty matches this article.
More in Enterprise Data Engineering
Data Engineering for Startups: A 2026 Strategy Guide
Master data engineering for startups in 2026. Learn to assess maturity, choose cost-effective architectures, and build scalable foundations for AI and ML.
Data Engineering Vendor Evaluation Criteria: 35 Criteria for 2026
The complete 35-criterion evaluation framework for choosing a data engineering vendor in 2026 - definitions, verification, red flags, and weighting.

Data Engineering for SaaS Companies: Leaders' 2026 Guide
Elevate your data engineering for SaaS companies. This guide covers multi-tenancy, cost, vendor selection, & platform modernization for leaders.