A Leader's Guide to Apache Spark Optimization: Moving Beyond Quick Fixes
Apache Spark optimization is rarely a coding problem first. Most slow or expensive jobs trace back to one of four bottlenecks - CPU, memory, I/O, or network shuffle - and the fix is usually a configuration or architecture change, not a rewrite. This guide covers how to diagnose which bottleneck you actually have, the configuration and code changes that address each one, and when the problem has outgrown what an internal team can fix alone.
That diagnosis work matters more on managed platforms like Databricks or AWS EMR, where a badly tuned job burns compute credits every hour it runs. Spark tuning is common enough among data engineering specialists that 64 of the 86 firms profiled in the Data Engineering Companies Index list Databricks capability - a rough proxy for who has actually done this kind of tuning work at scale, since Databricks is built on Spark.
Why Are Slow Spark Jobs an Architectural Problem?
A single slow or failing Spark job is rarely just a bug - it’s usually a symptom of misaligned platform configuration or accumulated architectural debt that will keep costing money until someone fixes the root cause instead of the symptom. Treating it as a one-off wastes the lesson.
For an engineering leader, the goal isn’t to fix one job. It’s a resilient, cost-effective Spark ecosystem, which means moving from tactical troubleshooting toward strategic platform management. Three disciplines make that shift possible:
- Establishing performance baselines. You can’t improve what you don’t measure. Benchmarking jobs defines what “good” looks like for your workloads, turning optimization from guesswork into an evidence-based process.
- Implementing governance. Set clear standards for code quality, mandate efficient data formats (Delta, Parquet), and establish rules for resource allocation.
- Running architectural reviews on a cadence. Data layouts, partitioning strategies, and cluster configurations need periodic reassessment. The architecture that worked a year ago is often wrong for today’s data volume and velocity.
This shift turns Apache Spark optimization from a developer-level task into an architectural discipline, and it’s the only way to keep the long-term cost of your data engineering function under control.
For an engineering leader, every slow Spark job is a question about the platform’s architecture. The answer is never just “more memory”; it’s about building a system where performance is a feature, not a constant battle.
What’s the Right Way to Diagnose a Spark Performance Bottleneck?
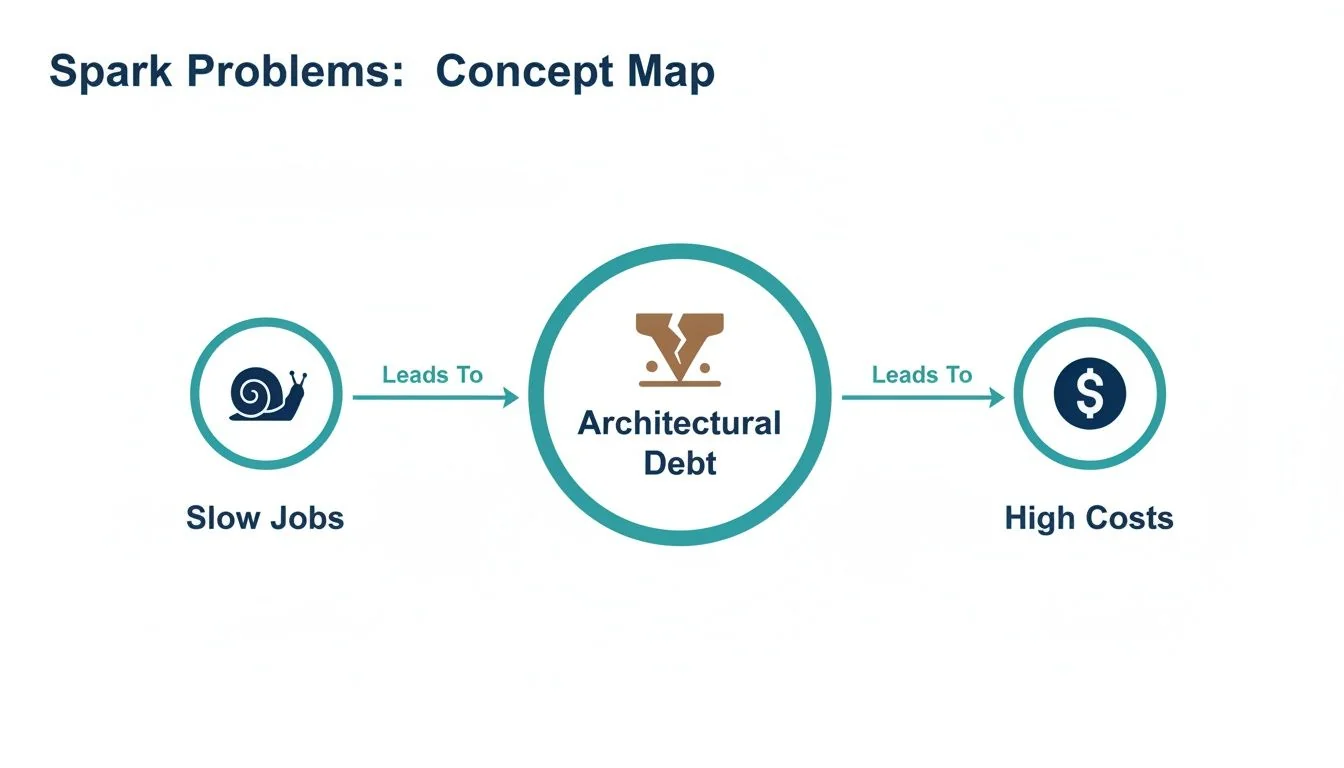
Diagnosis starts with evidence, not guesswork. A Spark application’s performance rests on four pillars - CPU, memory, I/O, and network - and a bottleneck in one destabilizes the whole system, which is how a slow job turns into architectural debt and then a higher cloud bill.
Before changing a line of code, gather evidence from the Spark UI and a cluster monitoring dashboard like Ganglia. You’re looking for clues that point to the actual bottleneck, not the first thing that looks slow.
Any optimization effort without clear metrics is just a guessing game. The Spark UI is your command center; its event timeline, stage details, and executor statistics hold the keys to nearly every performance puzzle.
Common Spark Bottlenecks and Diagnostic Signals
This framework connects observable symptoms to their underlying root cause, so the response is targeted instead of trial and error.
| Bottleneck Area | Common Symptoms | Key Metrics to Check (Spark UI & Logs) | Initial Remediation Step |
|---|---|---|---|
| CPU | Cluster CPUs are pinned at 100%; jobs run slowly despite low I/O. | High Executor CPU Time vs. Task Time. Check for Python UDFs in the DAG visualization. | Refactor code to use Spark native functions instead of UDFs; simplify complex transformations. |
| Memory | Frequent, long Garbage Collection (GC) pauses reported in executor logs; OutOfMemoryError (OOM) exceptions. | GC Time metric in the Spark UI’s Executors tab. High spill to disk. | Increase executor memory, tune GC settings, or repartition data to create smaller partitions. |
| I/O | Tasks spend most of their time in the Input Size / Records phase; low CPU utilization. | High Task Deserialization Time or Shuffle Read Blocked Time. Check data source format. | Convert data from JSON/CSV to a columnar format like Parquet or ORC to enable predicate pushdown. |
| Network (Shuffle) | Massive Shuffle Read/Write data shown in the Stage details; many tasks seem to hang. | Skewed Shuffle Read Size / Records across tasks. Check the DAG for wide transformations. | Avoid groupByKey in favor of reduceByKey; apply salting techniques to correct data skew in joins. |
The Four Suspects
-
CPU bottlenecks. A constantly maxed-out CPU isn’t a sign of efficiency - it often means the code is doing something Spark’s Catalyst optimizer can’t help with, like a Python UDF running complex logic, or transformations too heavy for the available compute.
-
Memory bottlenecks. An
OutOfMemoryErroris the obvious signal, but long Garbage Collection (GC) pauses are the more common one. If executor logs show frequent GC activity, workers are spending more time managing memory than processing data, usually because partitions are too large to fit in memory or caching is inefficient. -
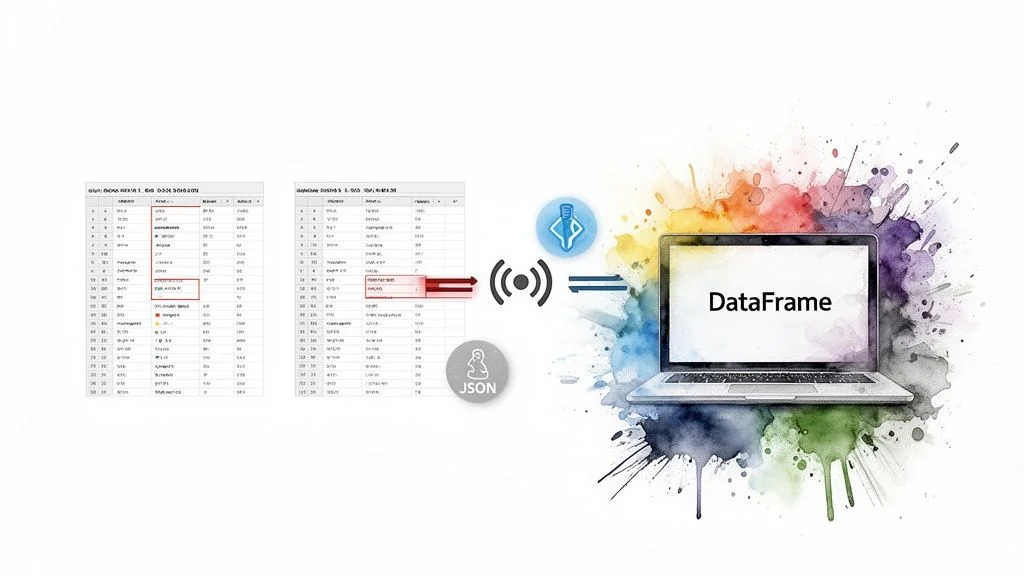
I/O bottlenecks. If a job spends most of its time reading data, the storage layer is the problem. Reading large text-based files like JSON or CSV is slow by nature. Switching to a columnar format like Parquet lets Spark read only the columns it needs and push filters down to the data source, cutting I/O substantially.
-
Network (shuffle) bottlenecks. Shuffle is the most expensive operation in distributed computing. A large volume of shuffle read/write data in the Spark UI points to a major culprit: redistributing data across the network, triggered by wide transformations like
groupByKeyor joins on poorly distributed keys.
Which Spark Configuration Changes Actually Cut Costs?
Spark’s default settings are built for broad compatibility, not for your workload, so running on defaults is a direct path to overspending on cloud infrastructure. Configuration is the main lever for balancing a cluster’s performance against its cost.
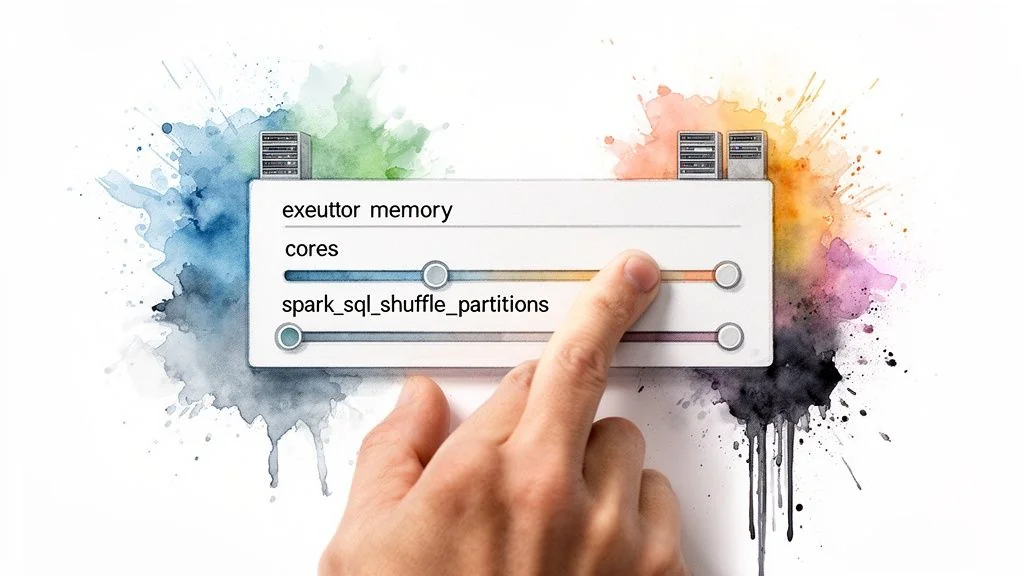
The highest-impact configurations are tied to executors, the worker processes that run tasks. The goal is to size and count executors so parallelism is maximized without stranding resources.
Sizing Your Executors Correctly
Two mistakes cause most of the damage: too many small executors, or too few large ones. Small executors add JVM management overhead. Large executors cause long garbage collection pauses and reduce parallelism.
A reliable starting point, instead of guessing:
- Assign cores per executor. The commonly recommended range is 4-6 cores per executor - enough parallelism per worker without I/O contention or excessive GC overhead.
- Calculate executor memory. Determine the memory required per core for your workload, then add roughly 10% for overhead (JVM, Spark internal structures). For example, with 5 cores and tasks needing 4GB per core, a starting point is
(5 * 4GB) + ~2GB overhead. - Determine the number of executors. Divide total available cluster cores by the cores assigned per executor. That’s how many workers can run concurrently.
This calculation is a far more reliable baseline than any vendor default.
Taming the Shuffle Partition Problem
The spark.sql.shuffle.partitions setting controls how many partitions a shuffle operation creates, and its default of 200 is almost never right for production workloads.
Getting this value wrong is expensive in both directions. Too many partitions adds scheduling overhead that outweighs the parallelism gained. Too few partitions creates oversized tasks that spill to disk and stall the whole stage. Tuning this one parameter, even by hand, is one of the most effective changes available before touching a line of code, per Spark’s own performance tuning documentation.
Key takeaway: if a shuffle stage processes 1TB of data with the default 200 partitions, each task receives a 5GB partition, which is a recipe for memory spills. Overcorrecting to 10,000 partitions creates tiny 100MB chunks, and performance dies from scheduling overhead instead. The right number is workload-dependent and requires tuning.
Modern Spark versions include Adaptive Query Execution (AQE) to dynamically merge small partitions, but AQE is not a substitute for proper configuration - it performs best when it starts from a reasonable number. Setting a sane baseline for shuffle partitions is still a fundamental part of tuning.
Which Code-Level Changes Deliver the Biggest Performance Gains?
A perfectly tuned cluster can’t compensate for poorly written code. The largest performance gains come from coding practices that guide developers toward code Spark can actually optimize.
The most important rule: use the DataFrame and Dataset APIs and avoid low-level Resilient Distributed Datasets (RDDs). RDDs are opaque to Spark’s Catalyst Optimizer, so Spark just executes the code as written, inefficiencies and all. With DataFrames, Catalyst understands the intent behind the code and can rearrange the execution plan for maximum efficiency.
The same principle extends to storage. File format is a code-level decision with real performance consequences.
Optimize Data Storage and Access
Spark’s performance is limited by how fast it can read data. Two practices matter most for high-performance pipelines.
-
Use columnar formats. Standardize on Parquet or Delta Lake. Row-based formats like CSV or JSON don’t scale for large processing jobs. Columnar storage enables predicate pushdown, letting Spark read only the columns a query needs and filter at the source.
-
Partition your data. Organize data into subdirectories based on a frequently filtered column (
date,country) to enable partition pruning, where Spark skips entire directories that don’t match a query’sWHEREclause. This can cut read times from hours to minutes.
A query scanning a petabyte-scale, non-partitioned JSON dataset will always be slow and expensive. The same query against a partitioned Parquet dataset might only need to read a few gigabytes. That’s not a minor tweak - it’s a fundamental architectural decision.
Master Join Strategy Optimization
Joins are a primary cause of network shuffles, and controlling the join strategy matters more than almost any other code-level decision.
-
Shuffle sort-merge join. Spark’s default for joining large tables. It shuffles and sorts both datasets across the network before merging - reliable, but heavy on network and disk I/O.
-
Broadcast hash join. The better strategy when one table is small enough to fit in each executor’s memory. Spark broadcasts a copy of the small table to every node, so the join happens locally without shuffling the large table. The threshold is configurable via
spark.sql.autoBroadcastJoinThreshold, which defaults to 10MB.
You have to explicitly tell Spark to use a broadcast join with a hint: broadcast(small_df). For join-heavy pipelines, this is often the single most effective code-level change available.
How Do Catalyst and Adaptive Query Execution Actually Work?
High-performance Spark code is written to work with Spark’s internal optimizers, not around them. Code is a high-level suggestion that two engines - the Catalyst Optimizer and Adaptive Query Execution (AQE) - deconstruct and rebuild for efficiency.
Using the DataFrame API matters because it’s the language Catalyst understands. Submit DataFrame code, and Catalyst translates the logic, applies hundreds of optimization rules, and generates the most efficient physical execution plan it can find.
Think of Catalyst as a grandmaster chess player. Your DataFrame code is the opening move. Catalyst calculates dozens of possibilities and chooses the sequence that leads to the fastest result. Handing it raw RDDs is like blindfolding the grandmaster - it can only follow the rigid path you’ve dictated.
Catalyst Plans, AQE Adapts
Catalyst plans execution before a job runs. Adaptive Query Execution (AQE) makes adjustments during execution, reacting to the unpredictable shape of real-world data.
AQE’s key runtime optimizations:
- Dynamically coalescing partitions. AQE automatically merges small, inefficient shuffle partitions into larger, more optimal chunks, reducing scheduling overhead.
- Switching join strategies. If AQE observes at runtime that one side of a planned sort-merge join is small enough for broadcast, it switches to the faster broadcast hash join on the fly.
- Optimizing skewed joins. AQE detects data skew where one partition is significantly larger than others, splits the oversized partition into smaller pieces, and distributes the work evenly so a single task doesn’t bottleneck the whole stage.
These optimizers work best with well-structured data and clean code, not as a substitute for either. Modern table formats like Databricks Delta Lake provide the statistics and structure Catalyst and AQE need to do this work well. The job of an engineering leader is to make sure teams build systems that work with these optimizers instead of against them.
When Should You Bring in a Data Engineering Consultancy?
Internal optimization effort hits a ceiling eventually. When your best engineers are perpetually firefighting the same jobs instead of building new capability, or cloud costs keep climbing despite tuning work, it’s time to bring in specialists.
That’s a strategic decision, not an admission of failure - deep system optimization is a specialized discipline that takes experience across many workloads and platforms, including Databricks and AWS EMR.
Vetting Potential Partners for Spark Expertise
Databricks capability is a reasonable starting filter, since Databricks is built on Spark and most firms doing serious Spark tuning work list it: 64 of the 86 firms in the Data Engineering Companies Index do. That’s a filter, not a guarantee - platform familiarity and hands-on tuning experience aren’t the same thing, so the vetting has to go further than a capability tag.
A great consultant doesn’t just tune your job; they diagnose the systemic platform issues that are causing the poor performance in the first place. They should leave you with not just a faster job, but a playbook to stop these problems from happening again.
Our guide on selecting a Databricks consulting partner covers the vetting process in more depth, and data pipeline monitoring tools is a useful companion read for what “ongoing” tuning should actually look like once a partner hands the system back to you.
Evaluation Checklist for Spark Optimization Partners
Use this checklist during discovery calls to identify real expertise.
- Benchmarking methodology. “Describe your process for benchmarking our current Spark jobs. What specific metrics do you use to establish a baseline before beginning optimization?”
- Large-scale tuning experience. “Describe a time you optimized a terabyte-scale Spark job. What was the root bottleneck, what steps did you take, and what were the measurable improvements in runtime and cost?”
- Cost optimization track record. “How do you connect performance tuning directly to cloud cost savings? Share a case study where you reduced a client’s Databricks or EMR bill through optimization alone.”
- Tooling and diagnostics. “What diagnostic tools do you use beyond the Spark UI? How do you analyze executor logs and JVM garbage collection issues at scale?”
Frequently Asked Questions About Spark Optimization
What Is the First Thing to Check for a Slow Spark Job?
Start with the Stages tab in the Spark UI - it’s the primary diagnostic dashboard. Look for stages with long runtimes, high volumes of shuffle read/write data, or significant task skew, where a few tasks take much longer than others. That view will quickly point to an I/O, network shuffle, or compute-bound problem.
How Does Adaptive Query Execution Change Tuning?
Adaptive Query Execution (AQE) acts as an automated tuning assistant, merging small shuffle partitions and mitigating data skew in joins at runtime, which reduces the need to hand-tune parameters like spark.sql.shuffle.partitions. It can’t fix fundamental architectural flaws, though. If source data is poorly partitioned, code is inefficient, or the cluster is wrongly sized, AQE only buys marginal improvement.
When Should I Use a UDF in Spark?
Treat a User-Defined Function (UDF) as a last resort, used only when the logic isn’t available as a built-in Spark function. Python UDFs are performance killers because they break Spark’s ability to optimize the end-to-end query plan and add serialization overhead between the JVM and a Python process. Native Spark functions are almost always the more performant choice.
Apache Spark optimization is a diagnosis problem before it’s a tuning problem: find the actual bottleneck, fix the configuration or code that causes it, and only then decide whether the remaining gap needs outside help. If you’re evaluating vendors for that outside help, the guide on where to find data engineering companies and the Databricks consulting directory are good places to compare vetted partners against the checklist above.
Researched & written by
Data-driven market researcher with 20+ years in market research and 10+ years helping software agencies and IT organizations make evidence-based decisions. Former market research analyst at Aviva Investors and Credit Suisse.
Previously: Aviva Investors · Credit Suisse · Brainhub · 100Signals
Vetted partners
Top Databricks Partners
Vetted firms whose specialty matches this article.
More in Databricks Consulting
Parquet vs Avro: A Technical Guide to Big Data Formats
Choosing between Parquet vs Avro? This guide provides a deep, practical comparison of performance, schema evolution, and use cases for data engineering.

What Is Lakehouse Architecture? A Practical Guide
Discover what is lakehouse architecture and how it merges data lakes and warehouses to power modern AI and analytics. An expert guide to the essentials.
Data Warehouse vs. Data Lake: A Practical Decision Guide
Choosing between a data warehouse vs data lake? This guide cuts through the noise with practical comparisons of architecture, cost, and real-world use cases.