Mastering Analytics In Finance For Enterprise Success
Analytics in finance turns raw data into actionable insights: accurate cash flow forecasts, proactive risk management, early fraud detection, and optimized treasury operations. By feeding real-time data into predictive models, finance teams detect shifts in demand or risk patterns before they materialize.
Understanding Analytics In Finance
Analytics in finance integrates scattered figures into a unified dashboard. Leaders gain visibility into cash flow trajectories and uncover hidden risks. This guide covers:
- Forecasting cash flow with precision and speed
- Detecting fraud before losses escalate
- Managing risk with probabilistic scenarios
- Optimizing treasury operations and liquidity
Analytics gives finance teams a real-time flight deck for data-driven decisions.
Why Analytics Matters Today
Agile financial planning is essential in December 2026. Relying on static reports leaves organizations exposed. Analytics layers context, speed, and forecasting on traditional spreadsheets, converting historical data into forward-looking insights.
Run stress tests in minutes rather than days to reallocate budgets before demand shifts. This guide walks through:
- Key concepts and frameworks
- Calculating business value and ROI
- Core use cases in action
- Data architecture and tooling
- Implementation roadmap and RFP checklist
You’ll move from foundational principles to enterprise deployment with practical examples and clear steps.
Understanding The Key Concepts
Think of your finance dashboard as a fitness tracker: it monitors revenue, expenses, and more, turning raw data into clear signals.
- Descriptive analytics (rear-view mirror): highlights past performance trends
- Diagnostic analytics (health check): probes deeper to identify root causes
- Predictive analytics (weather forecast): forecasts future outcomes using historical data
- Prescriptive analytics (GPS recalculation): recommends actions to stay on course
Descriptive analytics helps you understand what happened before moving forward.
Building A Clear Framework
- Descriptive analytics: review past results
- Diagnostic analytics: diagnose root causes
- Predictive analytics: forecast future outcomes
- Prescriptive analytics: decide and optimize actions
Learn how the modern data stack underpins each step in our modern data stack framework.
Key Takeaways
- Start with descriptive reviews to anchor understanding
- Use diagnostic checks to pinpoint issues
- Leverage predictive insights for proactive planning
- Apply prescriptive actions to optimize performance
Assessing Business Value And ROI
Finance executives require metrics in dollars and cents, not feature lists. Tie analytics projects to:
- Cost savings: automation reduces manual tasks
- Revenue uplift: smarter pricing, cross-selling, demand forecasting
- Risk reduction: fraud detection, compliance checks, credit risk models
Use NPV and IRR, but align figures with board priorities. Benchmarks: close the books 20% faster, not vague “efficiency” gains.
Mapping Initiatives To Metrics
Document data inputs, outputs, and resource requirements for each workflow to calculate cost per process and project revenue gains. For example:
A retailer invests USD 300k in a fraud detection pilot. In six months, it blocks USD 1.2M in fraudulent charges, yielding an IRR of 150%.
An example with precise numbers turns abstract analytics value into a board-ready case.
Scenario-Based ROI
ROI = (Total Benefits − Total Costs) / Total Costs
Develop three scenarios—best, expected, worst—to present realistic return ranges.
| Metric | Definition | Benchmark |
|---|---|---|
| Cost Savings | Dollars saved through process automation | 15–25% of processing costs |
| Revenue Uplift | Additional income from analytics-informed decisions | 5–10% incremental revenue |
| Risk Reduction | Losses avoided via improved detection and compliance | 10–20% reduction in exposure |
Focus on metrics affecting cost or revenue. Track leading indicators (faster reports) alongside lagging indicators (actual savings).
As of 2025, the global financial analytics market was valued at USD 12.57 billion and is projected to reach USD 29.65 billion by 2033 at an 8.96% CAGR from 2026 to 2033. For details, see the IMARC Research report.
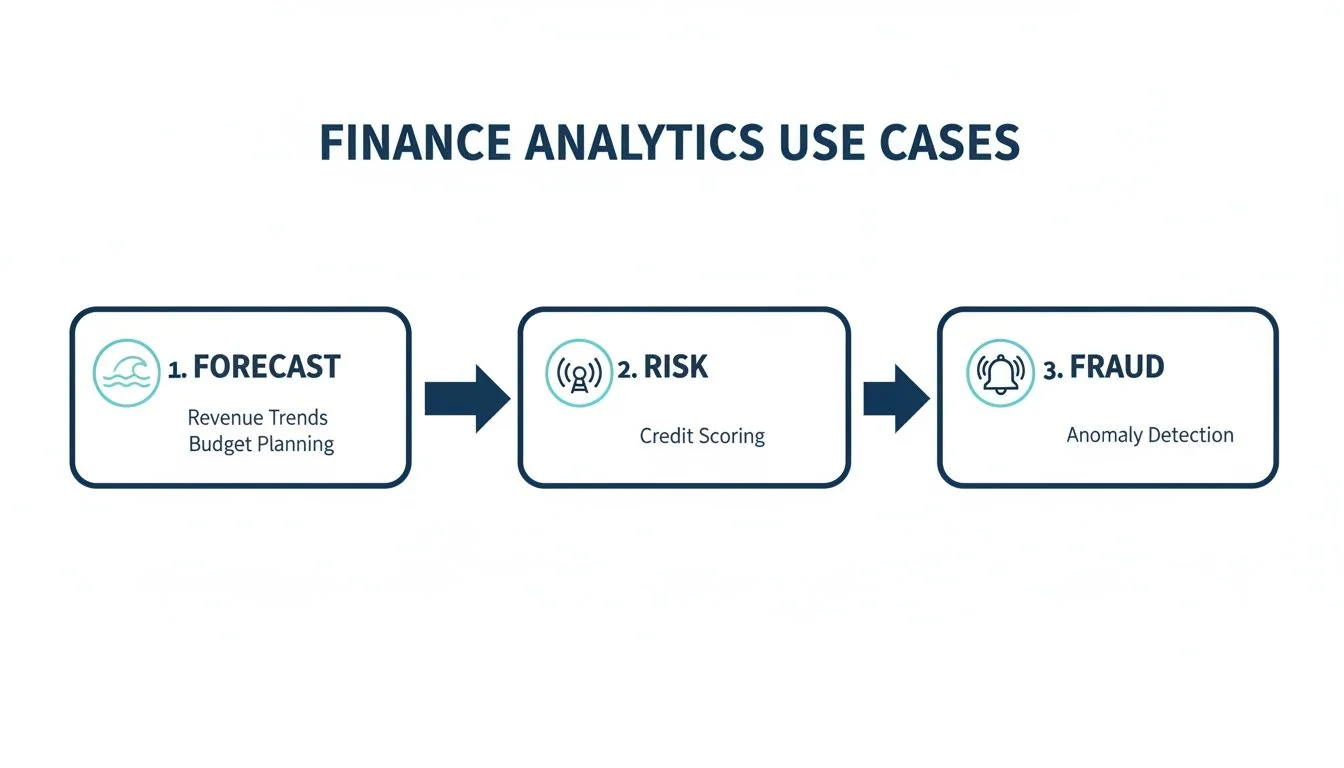
Exploring Core Use Cases
Analytics in finance yields measurable impact across five scenarios:
Cash Flow Forecasting
Forecasting cash flow is like reading a tide chart before high water. A global retail chain reduced its working capital cycle by 12%, freeing USD 45M in six months. Modeling optimistic, base, and pessimistic scenarios helps stress-test liquidity.
Risk Analytics
Risk analytics acts like underwater sonar. A major bank simulated credit exposure, reducing loan default rates by 20% and saving millions. Dynamic stress testing cut risk capital needs by 10%.
| Use Case | Description | Key Benefits |
|---|---|---|
| Cash Flow Forecasting | Charts future liquidity needs | Reduces working capital by 10–15% |
| Risk Analytics | Runs probabilistic scenarios | Lowers risk exposure and loss rates |
| Fraud Detection | Monitors transactions in real time | Cuts fraud losses by 30–50% |
| Performance Management | Visualizes key metrics | Improves operational efficiency |
| Treasury Optimization | Fine-tunes liquidity and funding strategies | Maximizes returns on cash reserves |
Real-Time Fraud Detection
Real-time detection acts like a smoke alarm for suspicious transactions. BFSI platforms cut fraud losses by 30–50% and reduce false positives by up to 40%. A credit card issuer cut manual reviews by 60%, focusing analysts on high-risk cases.
Performance Dashboards
Dashboards offer immediate insights. One tech firm cut decision time by 30%, boosting process efficiency by 15%. Self-service reporting reduced budget variances by 8% in a quarter.
Treasury Optimization
Treasury optimization keeps funds where they’re needed. A global manufacturer overhauled its debt structure, cutting interest costs by 18% and unlocking USD 60M. Forward-looking FX and rate forecasts reduced FX losses by 5% and increased net interest income.
Implementation delivers ROI through cost savings, revenue streams, and risk management. Mapping use cases to your environment creates a durable advantage.
Designing Data Architecture And Tooling
Data architecture is the plumbing of analytics operations. Raw figures stream in, get cleaned, and flow to analysis without compromising live reports.
Pipeline Components
- Raw data ingestion from ERP, CRM, and market sources
- ETL processes to cleanse and transform data
- Data lakes for structured tables and unstructured logs
- Analytics sandboxes for rapid prototyping
Structured vs. Unstructured Data
Combine schema-on-write for financial tables with schema-on-read for logs. Cloud platforms let you scale storage and compute independently.
As of December 2026, the cloud-based financial analytics market stands at USD 12.49 billion, on track for USD 21.27 billion by 2030 at an 11.2% CAGR. See the Mordor Intelligence report.
Platform Comparison
| Feature | Snowflake | Databricks |
|---|---|---|
| Compute Elasticity | Auto-scale and auto-suspend | Dynamic clusters and pools |
| Data Processing | SQL-based ELT | Apache Spark for ETL and ML |
| Concurrency | Dedicated compute per warehouse | Shared compute across workloads |
| Cost Model | Per-second billing | DBUs plus compute usage |
Match attributes to peak loads and budget constraints.
Quality And Governance
Data quality and lineage are essential. Trace each number’s origin and transformation. For governance strategies, see our data governance consulting services.
Embed validation checks at pipeline start to minimize rework and maintain audit readiness.
- Document data flows and monitor pipeline health
- Implement access controls for audit readiness
- Revisit architecture as analytics needs evolve
Creating Implementation Roadmap And RFP Checklist
A clear roadmap breaks the project into four phases:
- Discovery
- Proof of Concept (POC)
- Pilot Deployment
- Enterprise Rollout
Phase Details
| Phase | Duration | Deliverables |
|---|---|---|
| Discovery | 2–4 weeks | Data inventory, use-case list, charter |
| POC | 4–8 weeks | Prototype models, KPI dashboard, feedback |
| Pilot | 6–12 weeks | Live integration, performance baselines |
| Rollout | 3–6 months | Training, change management, support |
Define data stewards, approval workflows, and audit trails. Align compliance with SOX or GDPR.
Cost And Engagement Models
Compare:
- In-house team (existing staff)
- External consultant (rapid ramp-up)
- Hybrid (internal plus specialist support)
Key cost drivers: storage and compute, personnel, software licenses, training. Use scenarios to forecast budgets.
RFP Evaluation
Evaluate vendors on:
| Criterion | Description |
|---|---|
| Performance | Query times, concurrency at peak volumes |
| Scalability | Data and user load handling |
| Support | SLA terms, escalation paths |
| Pricing | List rates, discounts, hidden fees |
| Governance | Security certifications, audit support |
Assign weightings, request client references, and compare total cost over 3–5 years. For details, see our data engineering RFP checklist.
Maintain engagement with regular updates, live demos, and feedback loops. Track adoption rates, data quality scores, and time-to-insight to refine the roadmap.
FAQ
Q: How does analytics in finance differ from static reporting?
A: Analytics provides real-time insights into cash flow swings and emerging risks, enabling budget adjustments in hours rather than weeks.
Q: How do I build a business case?
A: Link each initiative to cost savings or revenue uplift, model best/expected/worst scenarios, apply the ROI formula, and align metrics with board priorities. See the Assessing Business Value And ROI section.
Q: What data foundation supports real-time analytics?
A: A hybrid schema-on-write and schema-on-read approach supports streaming ingestion and in-memory compute. See Designing Data Architecture And Tooling.
Q: How do I enforce governance and compliance?
A: Assign data stewards, establish approval workflows, maintain audit trails, and use policy-as-code tools to enforce permissions. See Creating Implementation Roadmap And RFP Checklist.
For vetted analytics consultants, see DataEngineeringCompanies.com.
Data-driven market researcher with 20+ years in market research and 10+ years helping software agencies and IT organizations make evidence-based decisions. Former market research analyst at Aviva Investors and Credit Suisse.
Previously: Aviva Investors · Credit Suisse · Brainhub · 100Signals
Top Data Engineering Partners
Vetted experts who can help you implement what you just read.
Related Analysis
A Practical Guide to Cloud Data Integration for Modern Data Stacks
Discover cloud data integration essentials, compare ETL vs ELT, and learn to secure and optimize your data strategy with trusted partners.
What Is Data Fabric? A Practical Guide to Modern Data Architecture
Confused about what is data fabric? This guide explains its architecture, compares it to data mesh, and shows how it solves today's complex data challenges.
Data Warehouse vs. Data Lake: A Practical Decision Guide
Choosing between a data warehouse vs data lake? This guide cuts through the noise with practical comparisons of architecture, cost, and real-world use cases.